

Bridging the gap between data entry and analysis accelerates decision-making. This guide explores tools—from spreadsheets and databases to BI platforms and programming solutions—that streamline workflows, improve accuracy, and empower organizations to turn raw data into actionable insights.
Data sits at the heart of every business decision. Yet many organizations struggle with the gap between collecting raw information and transforming it into actionable insights. The journey from data entry to meaningful analysis often involves multiple platforms, manual transfers, and countless hours of reformatting.
This disconnect creates bottlenecks that slow down decision-making and increase the risk of errors. When your sales team enters customer information in one system, your marketing team exports it to another platform, and your analysts spend hours cleaning it up before they can even begin their work, valuable time and resources slip away.
The solution lies in tools that seamlessly connect data entry with analysis capabilities. These platforms eliminate the traditional handoffs between data collection and insight generation, allowing teams to move from raw information to strategic decisions faster than ever before.
This guide explores the most effective tools that bridge this gap, helping you streamline your data workflow and unlock insights that drive growth. Whether you’re a small business owner managing customer relationships or a data analyst working with complex datasets, these solutions can transform how your organization handles information.
Understanding the Data Entry to Analysis Pipeline
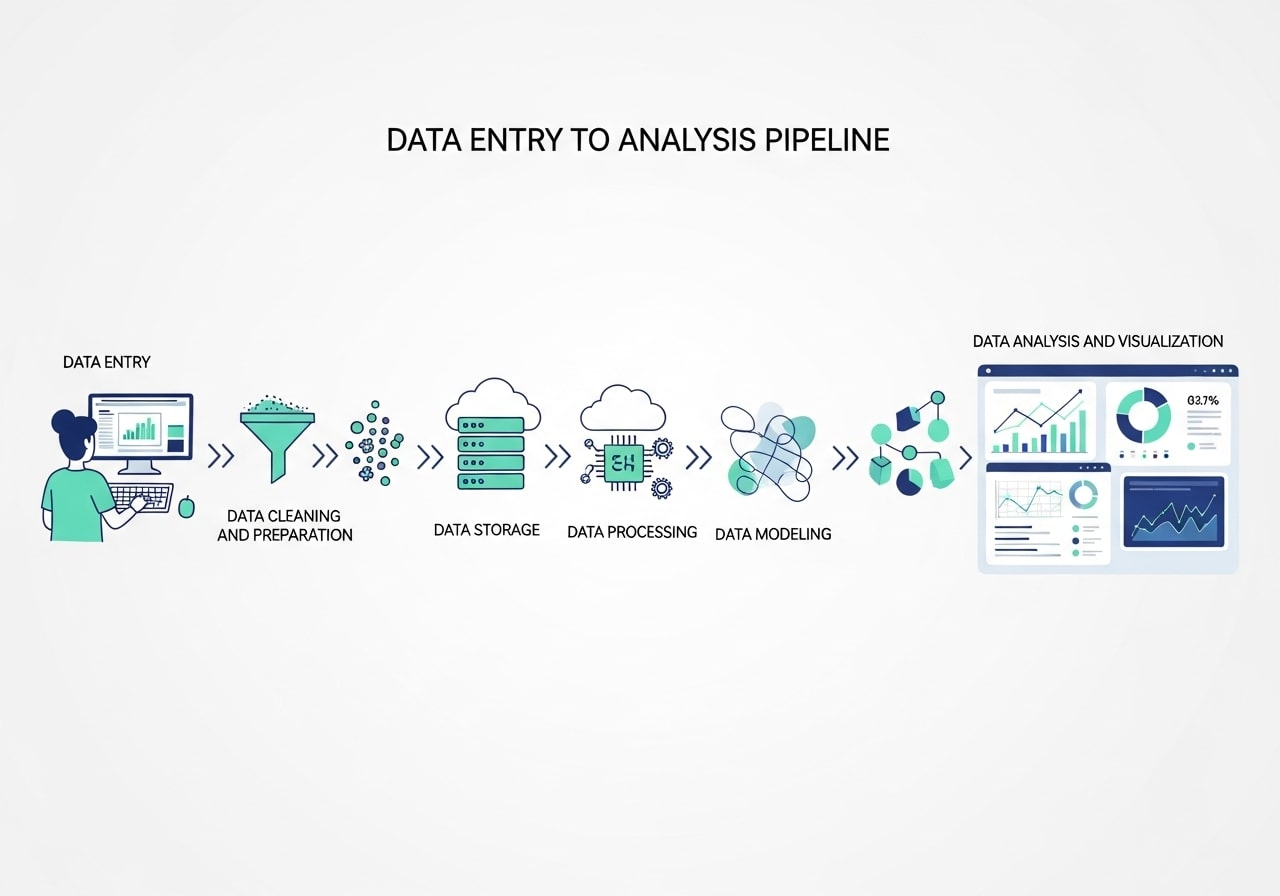
Most businesses follow a predictable pattern when working with data. Information enters the system through various touchpoints: customer interactions, sales transactions, marketing campaigns, or operational processes. This raw data then needs cleaning, organizing, and formatting before analysts can extract meaningful patterns and insights.
Traditional approaches often require separate tools for each stage. Data entry happens in one application, storage in another, cleaning in a third, and analysis in yet another platform. Each transition introduces potential for errors and delays.
Modern integrated tools eliminate these friction points by handling multiple stages within a single environment. They accept raw data input while simultaneously offering analysis capabilities, creating a smooth workflow from collection to insight.
Common Challenges in the Data Workflow

Even with modern tools available, many organizations face recurring challenges that prevent smooth transitions from raw data to insights. One of the most common issues is inconsistent data entry, where different team members use varying formats, naming conventions, or incomplete fields. This inconsistency forces analysts to spend unnecessary time cleaning and restructuring data before analysis can begin.
Another challenge is siloed systems. When sales, marketing, finance, and operations all use separate platforms, data becomes fragmented. Without integrations, businesses rely on time-consuming manual exports that introduce errors and delay reporting.
A third challenge is lack of real-time visibility. When data updates slowly or requires manual refreshes, leaders cannot make timely decisions. This lag creates missed opportunities and reactive strategies instead of proactive ones.
Spreadsheet-Based Solutions
Microsoft Excel with Power Query
Excel remains a cornerstone of business data management, but Power Query transforms it from a simple spreadsheet into a powerful data processing tool. This feature allows you to connect directly to various data sources, clean and transform information automatically, and refresh analyses with updated data.
Power Query handles common data entry challenges like removing duplicates, standardizing formats, and combining information from multiple sources. Once your data is clean, Excel’s built-in analysis tools, including pivot tables, charts, and statistical functions, provide immediate insights.
The platform excels in environments where team members already understand Excel basics. Training requirements remain minimal, and the familiar interface reduces adoption barriers.
Google Sheets with Apps Script
Google Sheets offers cloud-based accessibility with surprisingly robust data analysis capabilities. Apps Script extends these features by automating data collection from web sources, APIs, and other Google services.
This combination works particularly well for businesses that need real-time collaboration on data projects. Multiple team members can enter data simultaneously while automated scripts ensure consistency and accuracy. Built-in sharing features make it easy to distribute insights across the organization.
The platform’s strength lies in its integration with other Google services. Data from Google Forms, Google Analytics, and Google Ads can flow directly into sheets where analysis happens in real-time.
Database-Centric Platforms
Microsoft Access
Access provides a middle ground between simple spreadsheets and complex database systems. Its forms feature streamlined data entry by providing user-friendly interfaces that ensure consistency and accuracy. Meanwhile, its query and reporting tools enable sophisticated analysis without requiring advanced technical skills.
The platform handles relational data particularly well, making it ideal for businesses that need to connect information across multiple categories. Customer data can link to sales records, which connect to product information, creating a comprehensive view of business operations.
Access works best in Windows-centric environments where data volume exceeds spreadsheet capabilities but doesn’t require enterprise-level database solutions.
Airtable
Airtable combines the simplicity of spreadsheets with the power of databases. Its interface feels familiar to Excel users, but underlying database functionality enables more sophisticated data relationships and analysis.
The platform shines in collaborative environments where different team members need different views of the same data. Marketing teams can see campaign performance while sales teams focus on lead progression, all working from the same underlying dataset.
Pre-built templates speed implementation for common use cases like project management, content planning, and customer relationship management.
Business Intelligence Tools
Tableau Prep and Tableau Desktop
Tableau’s ecosystem addresses both data preparation and analysis within connected applications. Tableau Prep handles data cleaning, combining, and shaping, while Tableau Desktop creates sophisticated visualizations and analyses.
This combination excels when working with large datasets or complex data sources. The visual interface makes it accessible to non-technical users, while advanced features satisfy the needs of professional analysts.
The platform’s strength lies in its visualization capabilities. Even complex analyses become accessible when presented through interactive dashboards and compelling visual narratives.
Power BI
Microsoft’s Power BI platform integrates data preparation, analysis, and sharing within a single environment. Power Query handles data entry and cleaning, while Power BI Desktop creates analyses and visualizations.
The platform works exceptionally well in Microsoft-centric environments, connecting seamlessly with Office 365, Azure, and other Microsoft services. This integration reduces setup complexity and provides familiar interfaces for existing Microsoft users.
Power BI’s sharing and collaboration features enable organization-wide access to insights through web-based dashboards and mobile applications.
Specialized Analysis Platforms
R with RStudio
R provides unmatched flexibility for statistical analysis, while RStudio creates an integrated environment that handles everything from data import to report generation. The platform excels when sophisticated statistical analysis is required.
R’s extensive package library means it can handle virtually any type of analysis, from basic descriptive statistics to advanced machine learning algorithms. RStudio’s interface makes this power accessible through features like code completion, integrated help, and visual debugging.
This combination works best for organizations with technical team members who need advanced analytical capabilities.
Python with Jupyter Notebooks
Python’s data science libraries, combined with Jupyter’s interactive notebook environment, create a powerful platform for both data processing and analysis. Libraries like pandas handle data manipulation, while matplotlib and seaborn create visualizations.
Jupyter notebooks document the entire analysis process, making it easy to share methodology and reproduce results. This transparency proves valuable for organizations that need to explain their analytical approaches to stakeholders or regulatory bodies.
The platform’s flexibility means it can handle any type of data or analysis requirement, making it ideal for organizations with diverse analytical needs.
Cloud-Based Integrated Solutions
Google Data Studio
Data Studio connects directly to various data sources and provides immediate visualization capabilities. The platform eliminates traditional data entry by pulling information directly from sources like Google Analytics, Google Ads, and various databases.
Real-time connectivity means analyses update automatically as new data arrives. This feature proves particularly valuable for monitoring ongoing campaigns or operational metrics.
The platform’s sharing features make it easy to distribute insights across organizations through interactive dashboards accessible via web browsers.
Amazon QuickSight
QuickSight provides enterprise-scale business intelligence with integrated data preparation and analysis capabilities. The platform handles large datasets efficiently while providing user-friendly interfaces for both technical and non-technical users.
Machine learning features automatically identify patterns and anomalies in data, reducing the manual effort required to generate insights. Pay-per-use pricing makes it accessible for organizations of various sizes.
Integration with other Amazon Web Services creates seamless workflows for organizations already using AWS infrastructure.
Choosing the Right Tool for Your Organization
Selecting the appropriate tool depends on several factors: data volume, technical expertise, collaboration requirements, and existing technology infrastructure.
Small businesses with straightforward data needs often find spreadsheet-based solutions sufficient. These platforms provide immediate value with minimal learning curves and setup requirements.
Organizations with larger data volumes or complex analytical requirements benefit from business intelligence platforms. These tools handle scale while providing sophisticated analysis capabilities.
Technical teams may prefer programming-based solutions that offer maximum flexibility and advanced analytical capabilities. These platforms require more expertise but provide unlimited customization options.
Consider your organization’s growth trajectory when making decisions. Tools that meet current needs may become limitations as data volume and analytical requirements expand.
Implementation Best Practices
Successful implementation requires careful planning and change management. Start by mapping your current data workflow to identify bottlenecks and inefficiencies. This analysis helps prioritize which improvements will provide the greatest impact.
Begin with pilot projects that demonstrate value quickly. Success stories build momentum and support for broader implementation across the organization.
Invest in training to ensure team members can fully utilize chosen tools. Even the most powerful platform provides limited value if users don’t understand its capabilities.
Establish data governance practices that ensure accuracy and consistency. Clear guidelines for data entry, validation, and analysis help maintain quality as usage expands.
Plan for scalability by choosing tools that can grow with your organization. Switching platforms becomes more difficult as data volume and user dependence increase.
Maximizing Your Data Investment
The gap between data entry and analysis represents more than just a technical challenge. It reflects an opportunity to accelerate decision-making and improve business outcomes. Tools that bridge this gap don’t just save time—they enable organizations to respond more quickly to market changes and customer needs.
Start by evaluating your current data workflow to identify the biggest pain points. Whether you need the simplicity of enhanced spreadsheets or the power of specialized analysis platforms, the right tool can transform how your organization turns raw information into strategic advantage.
The most successful implementations combine the right technology with proper training and clear processes. Take time to select tools that match your organization’s technical capabilities and growth objectives, then invest in the support needed to maximize their value.
Frequently Asked Questions (FAQ) – Data Entry to Analysis Tools
1. Why do businesses struggle to go from data entry to analysis?
Because data often lives in multiple disconnected systems, requiring manual transfers, cleaning, and reformatting that create delays and increase the risk of errors.
2. What are integrated data tools?
These are platforms that combine data entry, cleaning, storage, and analysis in one environment, reducing bottlenecks and streamlining workflows.
3. Are spreadsheets still useful for modern data workflows?
Yes. Tools like Excel with Power Query and Google Sheets with Apps Script offer automated data cleaning, collaboration, and real-time analysis capabilities.
4. What’s the difference between spreadsheet tools and database platforms?
Spreadsheets work well for smaller datasets and quick analysis, while database platforms like Access or Airtable handle larger, relational data with more structure and accuracy.
5. When should a business use business intelligence (BI) tools?
BI tools like Tableau or Power BI are best when dealing with large datasets, complex reporting needs, or organization-wide dashboards.
6. Who should consider R or Python for analysis?
Organizations with technical teams that need advanced analytics, machine learning, or customizable workflows benefit most from programming-based solutions.
7. Are cloud-based tools better for real-time insights?
Yes. Tools like Google Data Studio and Amazon QuickSight pull live data directly from connected sources, updating dashboards automatically.
8. How do I choose the right tool for my organization?
Consider data volume, team expertise, collaboration needs, existing tech stack, and your future growth plans.
9. What is the biggest mistake companies make with data tools?
Choosing platforms without investing in proper training or governance, which leads to underuse, inconsistent data, and poor decision-making.
10. How can I ensure a smooth implementation?
Start with small pilot projects, train your team, set clear data standards, and choose scalable tools that can grow with your needs.


