Learn how to export LinkedIn Analytics data to Excel with this comprehensive guide. Discover actionable insights, advanced Excel techniques, and strategies to optimize your content performance, audience engagement, and marketing campaigns for strategic growth.
Analyzing what works on a professional social network like LinkedIn offers a treasure trove of insights for social media managers, data analysts, and marketers. These metrics allow you to understand audience reactions, monitor your content’s performance, and adjust your strategy for better results. For true data enthusiasts, exporting this information to Excel opens new doors for deeper customization, comprehensive analysis, and detailed reporting.
This article will guide you through accessing and exporting LinkedIn analytics data to Excel with a simple, step-by-step process. You will also discover actionable ideas to kickstart your data analysis in Excel and take full advantage of the insights LinkedIn provides.
The Power of LinkedIn Analytics for Strategic Growth
Before diving into the mechanics of exporting data, it is crucial to understand why LinkedIn analytics is such a vital component of any modern marketing or social media strategy. The platform provides a rich dataset that, when properly interpreted, can illuminate the path to professional growth, brand enhancement, and lead generation. This data is not just a collection of numbers; it’s a direct line to understanding your professional audience, their needs, and their behaviors. By harnessing LinkedIn analytics, you move from guesswork to data-driven decision-making, which is the cornerstone of effective digital marketing.
Understanding the nuances of your LinkedIn analytics allows you to measure the true impact of your content. Are your posts reaching the intended audience? Are they sparking meaningful conversations? Are they driving traffic to your website or generating leads? These are fundamental questions that LinkedIn analytics can help you answer with precision. Metrics such as post impressions, click-through rates (CTR), engagement rates, and detailed audience demographics provide a holistic view of your performance. These statistics enable you to gauge how well your content resonates, identify audience growth trends, and refine your posting schedule for maximum impact. Accessing and exporting this data is the first step toward digging deeper, spotting overarching trends, and generating comprehensive reports that inform smarter, more strategic decisions across all your campaigns.
Understanding Core LinkedIn Analytics Metrics
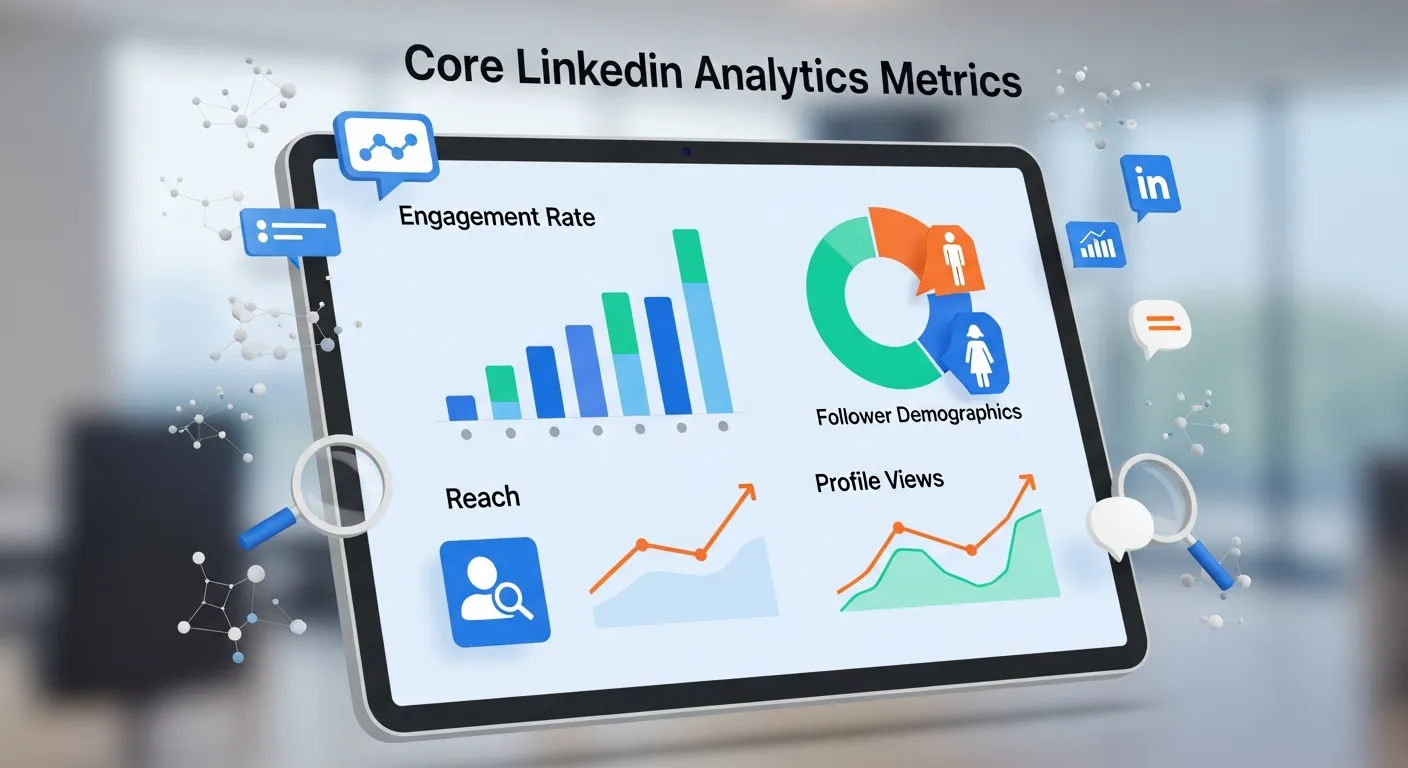
To effectively leverage LinkedIn analytics, you must first become fluent in the language of its metrics. Each data point tells a part of the story about your page’s performance and audience engagement. Let’s explore the primary categories of analytics available on LinkedIn and what they signify.
Visitor Analytics
Visitor analytics provide insights into the professionals who are viewing your Company Page, whether they follow you or not. This data is invaluable for understanding your page’s reach and the demographics of your audience.
- Page Views: This is the total number of times your Company Page tabs (e.g., Home, About, Jobs) were viewed. A high number of page views suggests strong interest in your brand.
- Unique Visitors: This metric counts the number of individual LinkedIn members who have visited your page. Comparing unique visitors to total page views can indicate how often people return to your page.
- Visitor Demographics: LinkedIn provides a detailed breakdown of your visitors by job function, seniority, industry, company size, and region. This demographic data is critical for ensuring you are attracting your target audience. For instance, if you are a B2B software company targeting senior-level IT managers, your LinkedIn analytics should reflect a high percentage of visitors from that group.
Understanding visitor trends helps refine your overall brand messaging and content strategy. For instance, a sudden spike in visitors from a specific industry might signal a new market opportunity to explore.
Update (Content) Analytics
Update analytics measure the performance of the individual posts you share on your Company Page. This is where you can assess the effectiveness of your content marketing efforts on a granular level.
- Impressions: The number of times your post was shown to LinkedIn members. This is a top-of-funnel metric that indicates your content’s reach.
- Clicks: The total number of clicks on your content, company name, or logo. This includes clicks on links, hashtags, and the “see more” expansion. A high click count signals that your content is compelling enough to prompt action.
- Click-Through Rate (CTR): Calculated as (Clicks / Impressions) x 100, CTR is a key indicator of how engaging your post’s headline and creative elements are.
- Reactions, Comments, and Shares: These engagement metrics show how your audience is interacting with your content. Reactions (Like, Celebrate, Support, Love, Insightful, Funny) provide a quick sentiment analysis, while comments and shares represent a deeper level of engagement.
Analyzing your update performance helps you understand what types of content resonate most with your audience. You can then double down on successful formats, topics, and messaging. Many social media management tools offer detailed breakdowns, but the native LinkedIn analytics platform is a powerful starting point. For broader insights, you can review expert guides—see more at insights linkedin analytics—to learn how industry leaders interpret these metrics.
Follower Analytics
Follower analytics track the growth and demographic makeup of your page’s follower base. A growing, relevant follower base is a key asset for long-term brand building on the platform.
- Total Followers: The cumulative number of LinkedIn members following your page.
- New Followers: The number of new followers gained over a specific period. This helps you track your page’s growth momentum.
- Follower Demographics: Similar to visitor demographics, this data breaks down your followers by job function, location, seniority, industry, and company size. It helps you verify that you are building a community of relevant professionals.
Comparing follower demographics to visitor demographics can reveal interesting patterns. For example, you might be attracting a wide range of visitors but only converting a specific segment into followers. This insight can help you tailor your content to appeal more broadly or to focus more intensely on your core target follower.
|
Metric Category |
Key Metrics |
Strategic Value |
|---|---|---|
|
Visitor Analytics |
Page Views, Unique Visitors, Visitor Demographics |
Understand your page’s overall reach and whether you are attracting the right professional audience. |
|
Update Analytics |
Impressions, Clicks, CTR, Reactions, Comments, Shares |
Measure the performance of your content, identify what resonates, and optimize your content strategy. |
|
Follower Analytics |
Total Followers, New Followers, Follower Demographics |
Track the growth of your community and ensure you are building a relevant and engaged follower base. |
By regularly reviewing these three pillars of LinkedIn analytics, you gain a comprehensive understanding of your performance. This knowledge empowers you to make informed adjustments to your strategy, ensuring your efforts on the platform contribute directly to your business objectives.
A Step-by-Step Guide to Accessing and Exporting LinkedIn Analytics
Now that you appreciate the strategic importance of the data, it’s time to get your hands on it. Exporting your LinkedIn analytics data is a straightforward process, but it requires you to have the correct permissions and know exactly where to look. This section will walk you through the entire process, from logging in to downloading your data file, ready for analysis. The ability to pull this data into a spreadsheet environment like Excel is what transforms raw numbers into a powerful tool for strategic planning.
To export LinkedIn analytics data, the first step is knowing where to find it within the platform’s interface. Only users with “Super Admin,” “Content Admin,” or “Analyst” roles for a Company Page can view and export its analytics. If you do not have one of these roles, you will need to request access from a page administrator. Once you have the necessary permissions, the process is simple and can be completed in just a few minutes.
Finding Your Analytics Dashboard
The LinkedIn analytics dashboard is the central hub for all performance data related to your Company Page. Following these steps will take you directly to it.
Step 1: Log in to Your LinkedIn Account
Begin by heading to linkedin.com and logging in with the credentials for your administrator or analyst account. Ensure you are using the profile that has been granted administrative access to the Company Page you wish to analyze.
Step 2: Navigate to Your Company Page
Once logged in, your personal feed will appear. To access your company’s assets, look for your profile icon in the top-right corner of the navigation bar. Click it to open a dropdown menu. Under the “Manage” section, you should see the Company Pages you administer. Select the specific page you want to analyze from this list. Alternatively, you can view your page by clicking the “Me” icon, then selecting your company page from the “My Pages” section.
Step 3: Access the Analytics Section
When you arrive at your Company Page’s admin view, you’ll see a navigation bar at the top, just below the company name and logo. This bar includes options like “Page,” “Content,” and “Analytics.” Click on the “Analytics” tab to open the main analytics dashboard. Here, you’ll find the three primary sub-tabs we discussed earlier: Visitors, Updates, and Followers. You can click into each of these to view the respective data visualizations and summaries directly on the platform. This dashboard provides a great high-level overview, but the real power comes from exporting the raw data. For those looking to integrate these insights with other analytics platforms and achieve a truly unified view of your marketing performance, it’s helpful to explore resources such as Mastering Google Analytics for Marketing Success for practical strategies and advanced techniques.
Exporting Your Data to an Excel-Ready File
Once you have navigated to the relevant analytics section, you are ready to export the data. LinkedIn has designed this feature to be intuitive for admins and analysts. The process is consistent across the Visitors, Updates, and Followers tabs, making it easy to pull all the data you need.
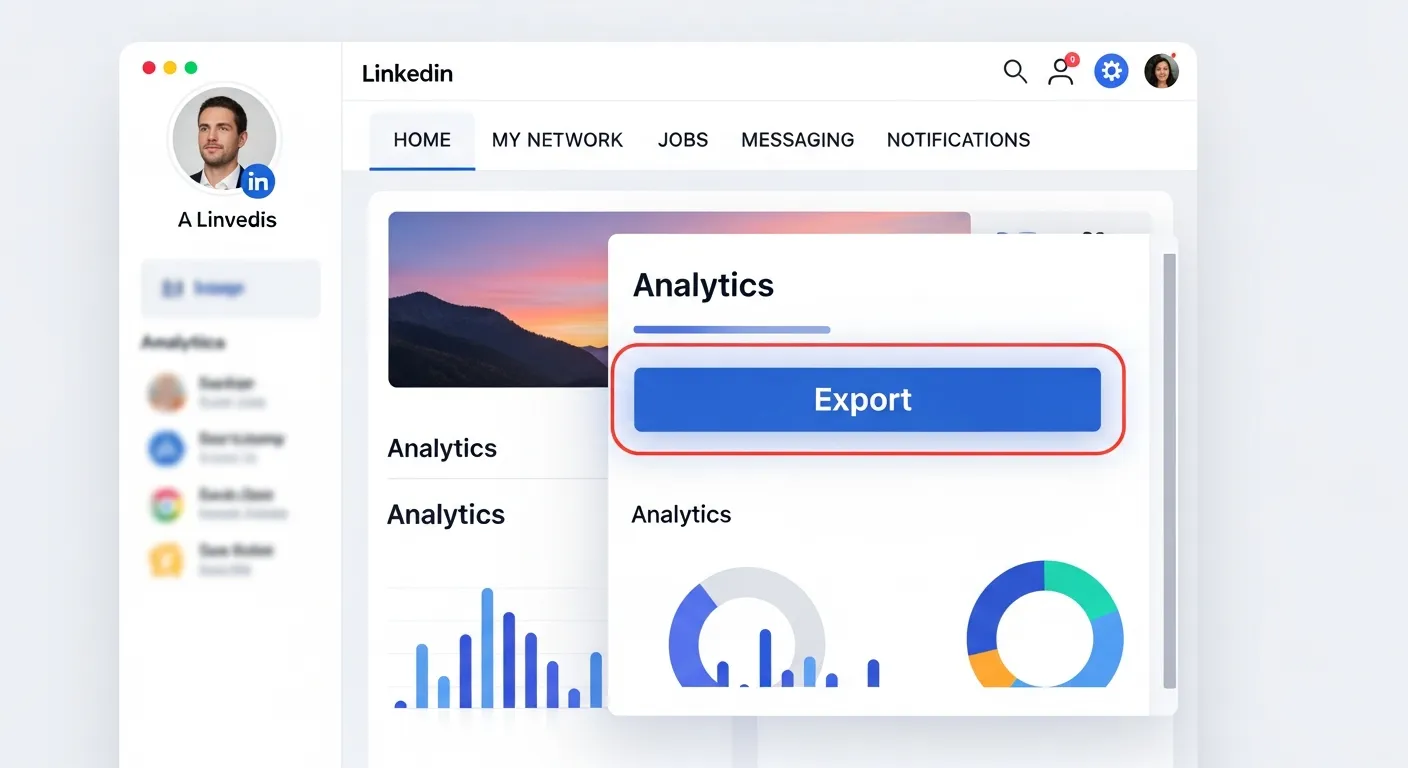
Step 1: Locate the “Export” Button
Within any of the analytics sections (Visitors, Updates, or Followers), look towards the top-right corner of the data visualization area. You will find an “Export” button, often accompanied by a small arrow icon. Clicking this button will initiate the export process.
Step 2: Select Your Timeframe
After clicking “Export,” a modal window will appear. This interface allows you to define the timeframe for the data you wish to download. LinkedIn typically offers predefined options such as “Last 7 days,” “Last 30 days,” or “Last 90 days.” You can also select a custom date range for more specific analysis, such as a particular campaign period or a fiscal quarter. The ability to export data from a specific timeframe is crucial for campaign-level reporting and trend analysis.
Step 3: Download the .XLSX File
Once you have selected your desired timeframe, click the “Export” button within the modal window. LinkedIn will then process your request and generate an Excel file (.xlsx) containing the requested data. Depending on the amount of data and the selected timeframe, this may take a few moments. The file will automatically download to your computer’s default downloads folder. It’s a good practice to rename the file immediately to something descriptive (e.g., “LinkedIn_Follower_Analytics_Q4_2025.xlsx”) and save it in a dedicated folder for your marketing analytics.
Step 4: Open and Prepare Your Data in Excel
Navigate to where you saved the downloaded file and double-click it. The file will open directly in Microsoft Excel or another compatible spreadsheet program. The data will be neatly organized into columns, with headers that correspond to the metrics you exported (e.g., Date, Impressions, Clicks, Engagement Rate). Your LinkedIn analytics data is now ready for the deep-dive analysis that will uncover actionable insights for your business.
|
Step |
Action |
Purpose |
|---|---|---|
|
1 |
Log in to LinkedIn and navigate to your Company Page. |
To access the admin view where the analytics tools are located. |
|
2 |
Click on the “Analytics” tab. |
To open the main dashboard for Visitors, Updates, and Followers data. |
|
3 |
Choose a data category (e.g., Updates) and click “Export.” |
To initiate the data export process for a specific set of metrics. |
|
4 |
Select the desired timeframe and confirm the export. |
To generate a file containing the precise data needed for your analysis. |
|
5 |
Open the downloaded |
To begin organizing, visualizing, and analyzing your raw LinkedIn analytics data. |
By following this process, you can routinely and efficiently extract valuable performance data from LinkedIn. This habit of regular data extraction is fundamental to maintaining an agile and responsive social media strategy that adapts to audience feedback and evolving market trends.
Advanced Data Analysis in Excel for LinkedIn Mastery
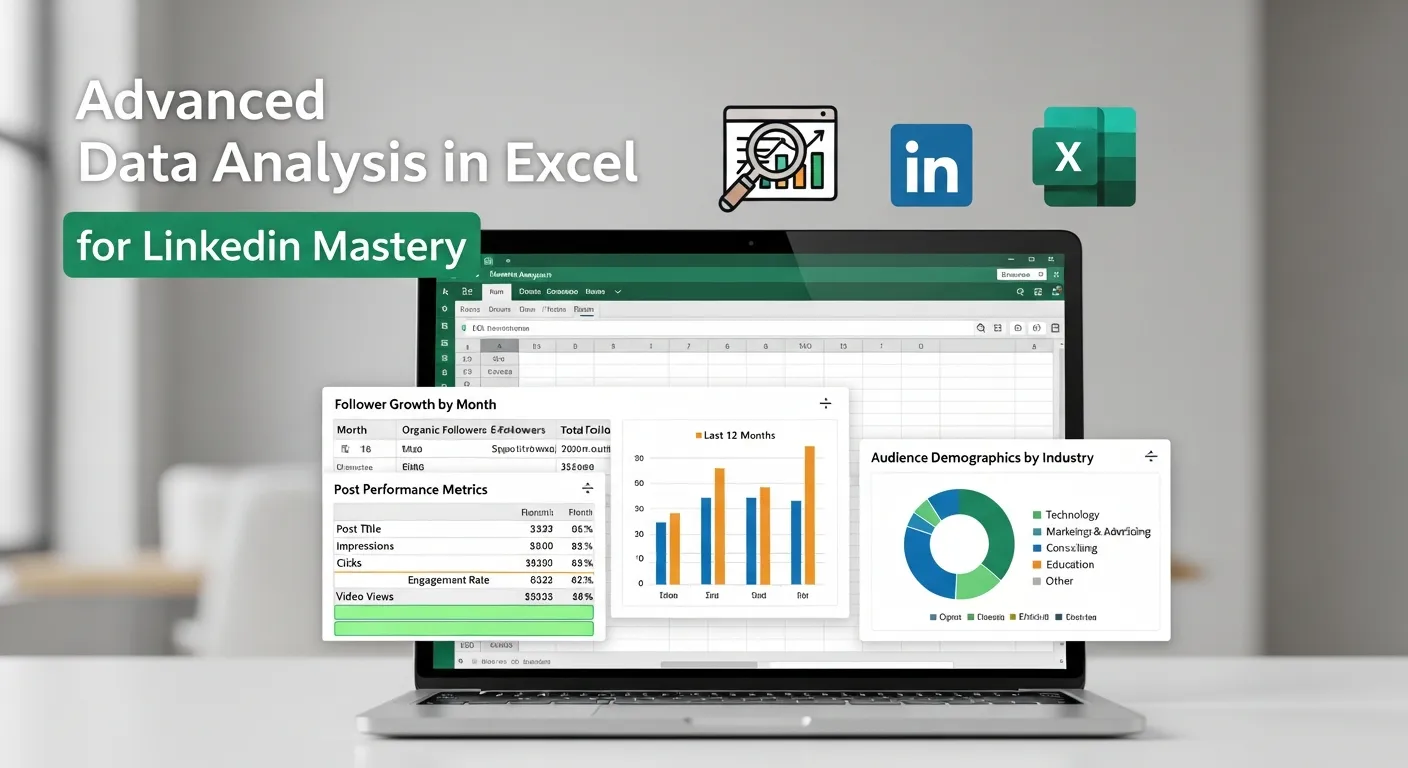
Exporting your LinkedIn analytics is just the beginning. The real magic happens when you use the powerful features of Microsoft Excel to process, analyze, and visualize that data. Raw data in a spreadsheet can be overwhelming, but with a few key techniques, you can transform it into clear, actionable insights that drive strategic growth. This section explores advanced methods for data analysis in Excel, helping you move beyond basic metrics to uncover deeper trends, patterns, and opportunities within your LinkedIn analytics data.
Once your data is in Excel, you have a sandbox for unlimited analytical exploration. You can create custom metrics, segment your data in ways not possible on the LinkedIn platform, and build dynamic dashboards to track your performance over time. This level of analysis separates proficient social media managers from truly elite strategists. By mastering these Excel techniques, you can provide more profound insights, justify your marketing spend with hard data, and make more accurate predictions about future performance.
Essential Excel Techniques for Analyzing LinkedIn Data
Let’s dive into some practical and powerful Excel tools and techniques that will help you make the most of your exported LinkedIn analytics data.
Organize and Clean Your Data
Before any analysis can begin, it’s crucial to ensure your data is clean and well-organized. The exported file from LinkedIn is generally clean, but you may want to make some adjustments.
- Freeze Panes: For large datasets, go to the “View” tab and select “Freeze Top Row.” This keeps your column headers visible as you scroll down, making the data much easier to read.
- Create a Table: Select your entire dataset and press
Ctrl + T(or go to Insert > Table). This formats your data as an official Excel Table, which unlocks features like easy sorting, filtering, and automatic formula extension. - Check for Inconsistencies: Quickly scan your data for any obvious errors or inconsistencies, although LinkedIn’s exports are typically reliable.
Use PivotTables for Dynamic Summaries
PivotTables are arguably Excel’s most powerful feature for summarizing and exploring large datasets. They allow you to dynamically rearrange your data to view it from different perspectives without altering the source data.
- How to Create a PivotTable: Select your data table, go to the “Insert” tab, and click “PivotTable.” Excel will prompt you to confirm the data range and choose where to place the PivotTable (a new worksheet is usually best).
- Example Use Cases for LinkedIn Analytics:
-
- Content Performance by Type: Drag “Post Title” or “Post Content” to the “Rows” area and metrics like “Impressions,” “Clicks,” and “Engagement Rate” to the “Values” area. This allows you to quickly see which posts performed best.
- Engagement Trends Over Time: Place “Date” in the “Rows” area (Excel will automatically group it by months and quarters) and “Comments,” “Reactions,” and “Shares” in the “Values” area. This will reveal patterns in your engagement throughout the year.
- Audience Demographics Breakdown: If analyzing follower or visitor data, you can use a PivotTable to count the number of followers from each “Industry” or “Country.”
PivotTables are essential for turning thousands of rows of raw LinkedIn analytics into a concise, understandable summary.
Visualize Data with Charts and Graphs
Humans are visual creatures, and turning your numbers into charts makes them easier to understand and present to stakeholders.
- Line Charts: Perfect for showing trends over time. Use a line chart to plot your follower growth, impressions per month, or average engagement rate over a quarter.
- Bar/Column Charts: Ideal for comparing categories. Use a bar chart to compare the total clicks generated by different content themes or the number of visitors from your top five countries.
- Pie Charts: Use sparingly, but they can be effective for showing composition, such as the breakdown of your audience by seniority level.
To create a chart, simply highlight the data you want to visualize (often from a PivotTable summary), go to the “Insert” tab, and choose your desired chart type from the “Charts” group. Visuals like these can also be enhanced by referencing additional marketing tools found at mobile marketing apps canva google analytics, making it easier to build comprehensive marketing reports that combine multiple analytics sources.
Leverage Formulas and Conditional Formatting
Excel’s formulas allow you to create custom calculations and automate your analysis.
Key Formulas:
=AVERAGE() to find the average engagement rate for a set of posts.
=SUM() to total impressions or clicks for a campaign.
=IF() to create conditional logic. For example, =IF(E2>0.02, "High Engagement", "Low Engagement") could automatically categorize your posts.
Conditional Formatting: This feature automatically changes a cell’s format (e.g., color) based on its value. You can find it on the “Home” tab. Use it to create heatmaps that instantly highlight your best and worst-performing content. For example, you can set a rule to color all cells with an engagement rate above 2% green and those below 0.5% red. This visual cue makes spotting outliers effortless.
|
Excel Feature |
Application for LinkedIn Analytics |
Strategic Benefit |
|---|---|---|
|
PivotTables |
Summarize engagement metrics by post, date, or content type. Analyze follower demographics by industry or job function. |
Quickly identify top-performing content and key audience segments without manual calculation. |
|
Charts & Graphs |
Create line charts for follower growth, bar charts for post comparisons, and pie charts for demographic breakdowns. |
Visualize trends and patterns, making data easier to interpret and present to others. |
|
Formulas (SUM, AVERAGE, IF) |
Calculate campaign totals, average performance benchmarks, and create custom performance labels. |
Automate calculations and create custom KPIs tailored to your specific business goals. |
|
Conditional Formatting |
Highlight high-performing posts in green and low-performing posts in red. Create color scales for engagement rates. |
Instantly spot outliers and performance trends directly within your raw data sheet. |
By combining these advanced Excel techniques, you can build a robust and repeatable process for analyzing your LinkedIn analytics. This allows you to spend less time manipulating data and more time deriving strategic insights that will elevate your professional presence and drive meaningful business results.
Frequently Asked Questions (FAQ)
1. What is the most important metric in LinkedIn Analytics?
There is no single “most important” metric; it depends entirely on your goals. For brand awareness, Impressions and Follower Growth are key. For content resonance, Engagement Rate (clicks, reactions, comments, shares divided by impressions) is crucial. For lead generation, Click-Through Rate (CTR) on posts with links is vital.
2. How often should I export and analyze my LinkedIn Analytics data?
For most businesses, a monthly analysis is a good starting point. This allows you to spot trends without getting lost in daily fluctuations. However, if you are running a specific, time-sensitive campaign, you should monitor and analyze your LinkedIn analytics on a weekly or even daily basis to make real-time optimizations.
3. Can I see who specifically viewed my LinkedIn profile or Company Page?
No, LinkedIn protects user privacy. For your Company Page, LinkedIn analytics provides aggregated, anonymous demographic data about your visitors (like their industry, job function, and location), but you cannot see the names of the individuals who visited. The same applies to personal profile views unless the viewer has open privacy settings.
4. What is a good engagement rate on LinkedIn?
A “good” engagement rate can vary by industry, audience size, and content type. However, a general benchmark to aim for is anything above 2%. Rates between 2% and 5% are considered very good. Consistently achieving an engagement rate above 1% is a solid performance for most Company Pages.
5. How can I use LinkedIn Analytics to improve my content strategy?
Use your LinkedIn analytics to identify your top-performing posts based on engagement rate and clicks. Analyze what these posts have in common. Are they videos? Do they feature customer stories? Do they ask questions? Replicate the successful formats and topics while reducing efforts on content types that consistently underperform.
6. Can I automate the process of exporting LinkedIn Analytics data?
LinkedIn’s native platform does not offer an automated export feature, so you need to manually export your data. However, many third-party social media analytics tools can connect to your LinkedIn account via API and provide automated reporting and dashboards, saving you the manual step. These types of solutions are foundational for understanding social media analytics across platforms—see more at analyzegenius.com/social-media-analytics-business-success/.
7. What is the difference between impressions and reach?
Impressions are the total number of times your content was displayed on a screen. Reach is the number of unique people who saw your content. If one person sees your post three times, that counts as three impressions but only one for reach. LinkedIn’s primary update metric is impressions.
8. How can I analyze competitor performance on LinkedIn?
LinkedIn offers a “Companies to track” feature within the Follower analytics section. You can add up to nine competitor pages to compare your total follower count and new follower growth against theirs. This provides a high-level competitive benchmark directly within your LinkedIn analytics dashboard.
9. Where can I learn more about data analysis in Excel?
Excel is a vast program, but many resources can help you master it for marketing analysis. Numerous online courses and tutorials focus specifically on data analysis functions like PivotTables, VLOOKUP, and charting. For a comprehensive introduction and step-by-step setup, check out this helpful guide: Install Data Analysis in Excel – A Complete Guide. This will ensure your software is ready for advanced LinkedIn Analytics work.
10. How does analyzing LinkedIn data help with lead generation?
By analyzing the clicks on posts that link to your website or landing pages, you can determine which topics and calls-to-action are most effective at driving traffic. Furthermore, analyzing the demographics of your most engaged audience helps you refine your targeting for future lead generation campaigns. For more on practical methods and real-world results, see this resource: Data Analysis in Social Media Lead Generation.