Data is everywhere. But without proper tools, it’s just noise. That’s where Python comes in. It’s not just a programming language—it’s a data powerhouse.
Python has become one of the most popular choices for data analysis today. Its simplicity, community support, and massive libraries make it ideal for working with data at all levels. Whether you’re cleaning raw data or building predictive models, It offers the flexibility and depth needed to get the job done effectively.
How Python Is Used to Power Today’s Technology
Python powers today’s technology by enabling rapid development across web applications, data science, artificial intelligence, automation, and cybersecurity. Its simple syntax, vast libraries, and strong community support make it ideal for building scalable systems, analyzing large datasets, and driving innovation in modern digital products and services worldwide.
Why Python Dominates in Data Analysis
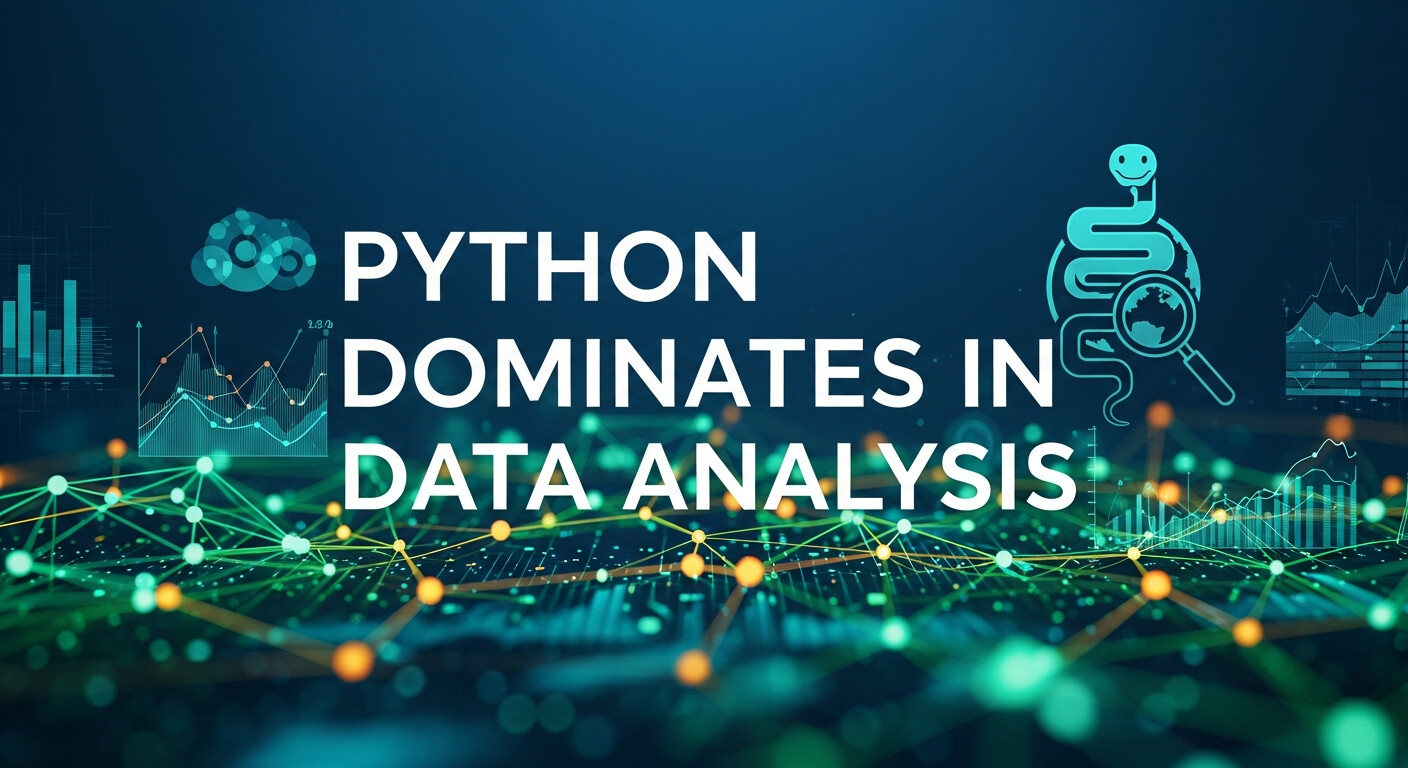
Python’s rise in data analysis isn’t random. Its clean syntax makes it accessible to beginners, while its robust capabilities satisfy experts.
From small tasks like calculating averages to complex ones like running machine learning models, Python adapts easily. This means one language can power your entire data pipeline—from gathering to visualizing insights.
Another major advantage? Python is open-source. That means you get a wide range of tools, libraries, and frameworks at no cost. It also boasts a huge global community, making it easy to find tutorials, troubleshoot issues, and discover better ways to work with data.
The Role of Python in Each Stage of Data Analysis
Data analysis isn’t a single step. It’s a process. Here’s how Python fits in at every stage.
1. Data Collection and Access
Before you analyze data, you need to gather it. Python allows seamless data collection from various sources:
-
APIs: Use Python libraries like
requeststo pull real-time data from APIs. -
Web scraping: With tools like
BeautifulSouporScrapy, Python can extract data from websites. -
Databases: Python connects to SQL and NoSQL databases with libraries like
SQLAlchemyorPyMongo. -
Files and spreadsheets: CSV, Excel, JSON—Python reads them all easily with
pandasoropenpyxl.
2. Data Cleaning and Preparation
Raw data is messy. Missing values, duplicates, wrong formats—Python helps fix all that. The pandas library shines here.
Let’s say you have missing values. One line of code using pandas can detect and handle them. Need to convert date formats or remove outliers? Python simplifies those tasks too.
Data preparation is often the longest part of analysis, and makes it less painful through automation and easy-to-read syntax.
3. Data Exploration
Once the data is cleaned, you need to understand what’s inside it. That’s where exploration begins.
Python helps identify trends, patterns, and anomalies. Using pandas for data summaries or seaborn for quick visualizations lets analysts understand relationships between variables without writing hundreds of lines of code.
This stage is often called exploratory data analysis (EDA), and it’s crucial. Python’s matplotlib, seaborn, and plotly libraries offer clear, customizable charts to bring insights to life.
4. Statistical Analysis
Want to run regressions, test hypotheses, or understand correlations? Python handles statistical analysis with ease.
With libraries like statsmodels and scipy, you can run a wide range of statistical tests. This helps validate findings and ensures your decisions are backed by data, not just intuition.
The combination of statistics and code allows analysts to repeat tests with new data quickly and accurately.
Integrating Python with Modern Customer Data Systems
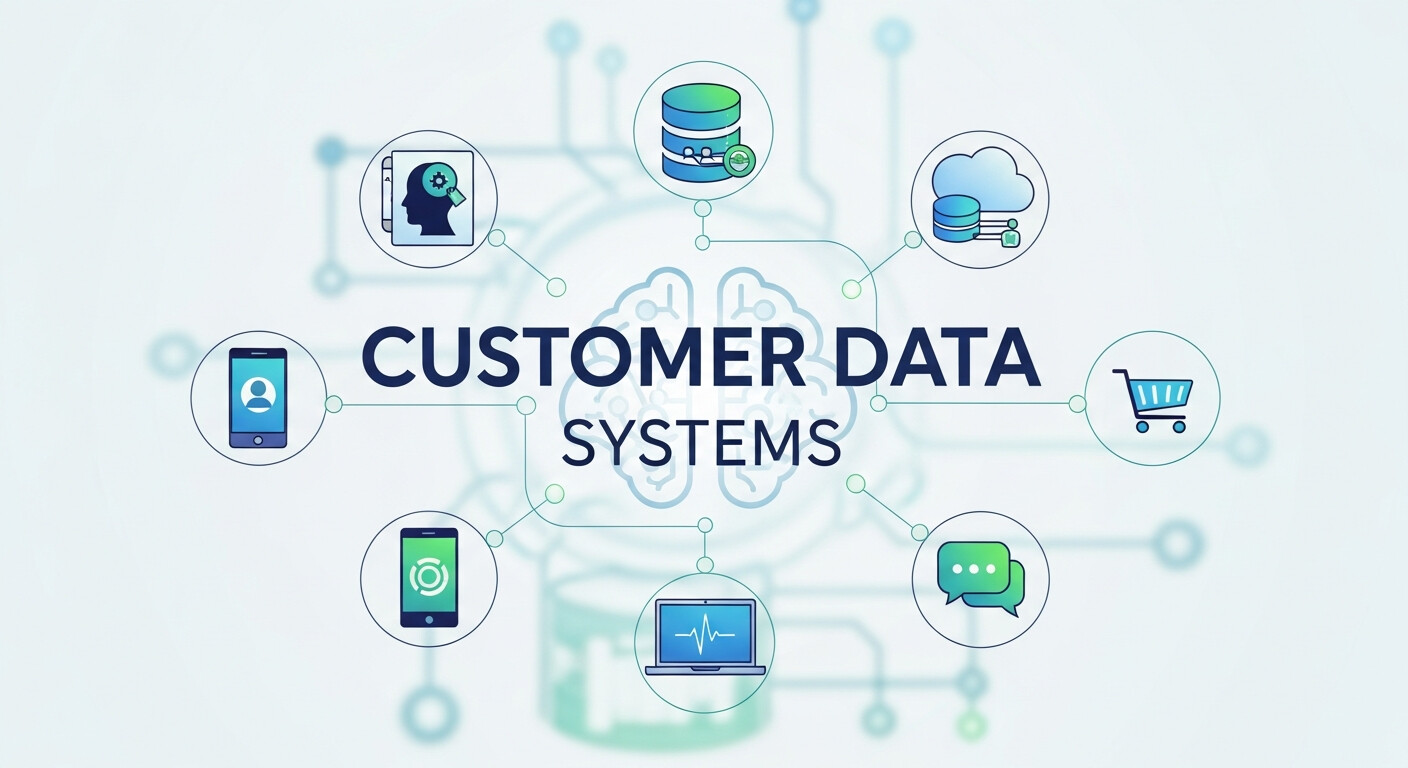
Python plays a crucial role in working with Customer Data Platforms by enabling seamless data integration, transformation, and analysis. These platforms collect customer information from multiple touchpoints, but Python helps turn that raw data into actionable insights. Using Python scripts, analysts can clean customer records, unify data sources, and build meaningful customer profiles. This allows businesses to understand behavior, preferences, and engagement patterns more clearly. Python’s flexibility also makes it easier to automate data flows between systems, ensuring customer data remains accurate, updated, and ready for analysis-driven decision-making.
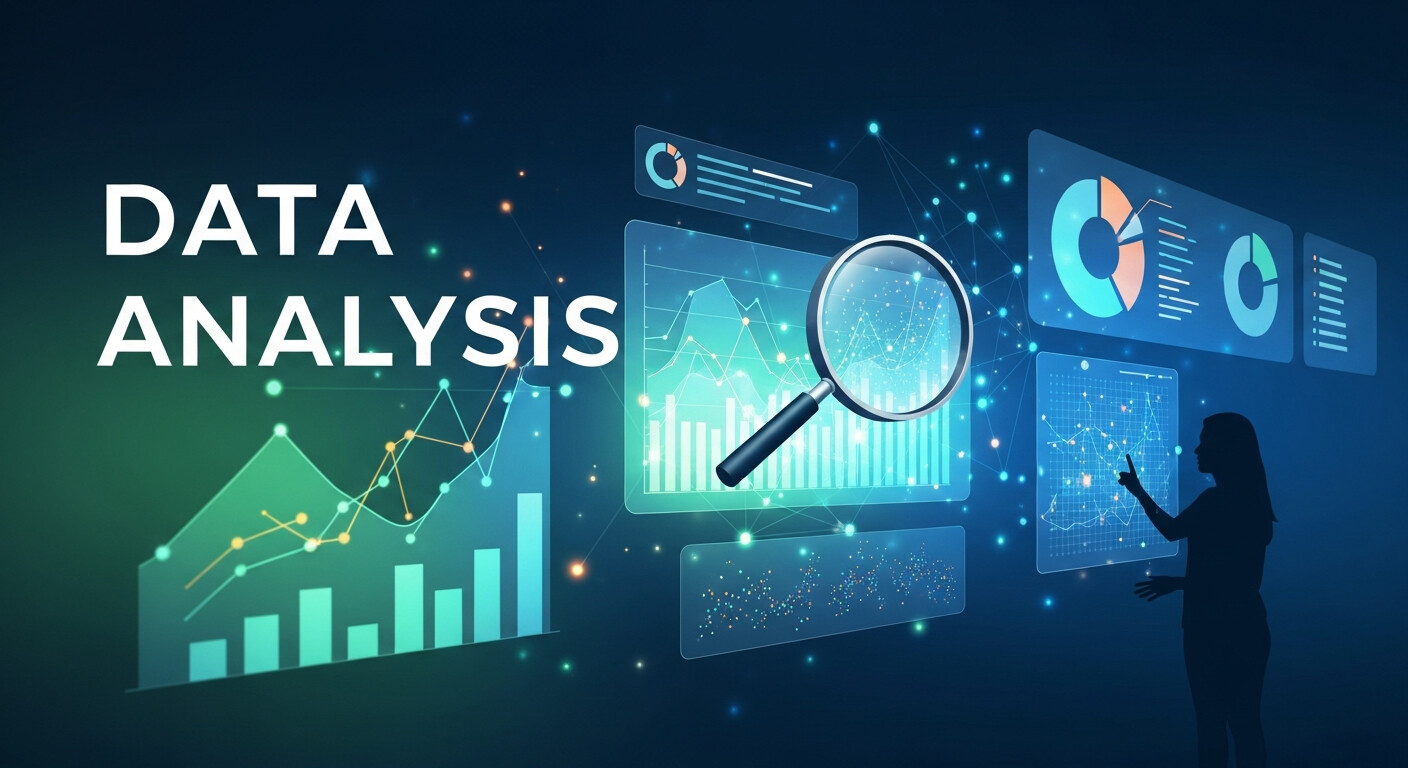
Turning Raw Information into Business Value
In today’s digital world, data alone has little value unless it’s properly analyzed. This is where Data Analysis Transforms raw numbers into insights that drive smarter decisions. Python enables this transformation by simplifying complex analytical tasks. From uncovering trends to predicting outcomes, Python helps organizations move from guesswork to evidence-based strategies. Its ability to process, visualize, and model data empowers teams to identify opportunities and reduce risks. As a result, businesses can improve performance, optimize operations, and respond faster to changing market conditions using data-backed insights.
Learning Python Through Structured Training Programs
A Data Analysis Bootcamp provides a fast and structured way to learn Python for real-world data problems. These programs focus on hands-on learning, teaching students how to clean datasets, perform analysis, and visualize results using Python libraries. Instead of only theory, learners work on practical projects that simulate industry challenges. This approach helps beginners gain confidence quickly while building job-ready skills. Bootcamps also emphasize problem-solving and best practices, making Python more approachable for those transitioning into data-related roles from non-technical backgrounds.
Enhancing Customer Insights with Advanced Analytics

Customer Data Platforms store massive volumes of user data, but Python unlocks their full analytical potential. By applying Python-based analysis, businesses can segment customers, predict churn, and personalize experiences. Python allows analysts to apply statistical models and machine learning techniques directly to customer datasets. This deeper analysis helps organizations move beyond surface-level metrics and understand customer journeys in detail. With accurate insights, teams can create targeted campaigns, improve retention, and deliver more relevant experiences that align with customer expectations and business goals.
From Analysis to Strategic Decision-Making
When applied correctly, Data Analysis Transforms how organizations think and act. Python enables this shift by making advanced analysis accessible and repeatable. Decision-makers can rely on dashboards, predictive models, and automated reports instead of intuition alone. Python’s ability to handle evolving datasets ensures insights remain relevant over time. This transformation impacts every department, from marketing to operations. As teams adopt a data-driven mindset, they become more agile, reduce uncertainty, and build strategies based on evidence rather than assumptions.
Preparing for Data Careers with Practical Skills
Joining a Data Analysis Bootcamp helps learners bridge the gap between theory and practice. Python is often at the core of these programs because of its industry relevance. Participants learn how to solve real data problems, collaborate on projects, and present findings clearly. This practical exposure prepares learners for professional environments where data-driven thinking is essential. Bootcamps also encourage continuous learning, helping students stay updated with evolving tools and techniques. As a result, learners gain both technical skills and confidence to pursue data-focused career opportunities.
Real-World Python Libraries Used in Data Analysis
Let’s take a closer look at some of the most used libraries:
Pandas
At the heart of most data tasks is pandas. It offers powerful tools to manipulate data, including filtering, grouping, and merging datasets.
Want to calculate the average of a column? You can do it with one line. Need to reshape your data for better visualization? pandas has built-in functions for that too.
NumPy
For numerical data and array operations, NumPy is essential. It underpins many other libraries and speeds up data operations significantly.
Matplotlib and Seaborn
When it’s time to visualize, matplotlib gives you control over every aspect of your chart. Seaborn, built on top of it, makes beautiful charts quickly with fewer lines of code.
Scikit-learn
If your analysis requires predictive models, scikit-learn is the go-to. From linear regression to decision trees and clustering, it supports a wide range of machine learning techniques.
Jupyter Notebooks
While not a library, Jupyter is a vital tool. It lets you write, test, and visualize code in one place, combining code and commentary. Analysts love it for documentation and sharing findings.
Python in Different Data Analysis Fields
Python’s flexibility makes it useful across industries.
-
Finance: Risk analysis, stock prediction, fraud detection.
-
Marketing: Customer segmentation, campaign analysis, churn prediction.
-
Healthcare: Patient data analysis, diagnostic models, treatment optimization.
-
E-commerce: Pricing strategies, trend analysis, product recommendation.
In every case, Python helps uncover actionable insights from raw data.
Automation and Scalability
Python isn’t just great for analysis. It also helps automate repetitive data tasks. Scheduling data cleaning, sending reports, or even building dashboards—It handles it all.
This automation means teams can focus on interpreting results instead of managing data manually. As your data grows, Python scales with it. Many libraries are designed to handle large datasets without performance issues.
Learning Curve and Community
Even if you’re new to coding, Python is beginner-friendly. It reads almost like English and avoids unnecessary symbols or complex syntax.
Beyond that, the Python data community is massive. There are tutorials, forums, online courses, and open-source projects. Whether you’re stuck on a problem or exploring a new tool, someone’s likely written about it.
This ongoing support helps people improve quickly and adopt best practices as they learn.
Python’s Future in Data Analysis
Python continues to evolve. With new libraries and updates rolling out constantly, it stays at the cutting edge of data work.
Its integration with AI and big data platforms ensures it will remain a top choice for analysts and scientists. As more businesses invest in data-driven decisions, Python’s role becomes even more crucial.
And the best part? You don’t need to switch tools as your needs grow. Python supports everything from basic analysis to advanced AI projects.
Final Thoughts
So, how is Python used in data analysis? In almost every way possible.
It helps collect, clean, explore, visualize, and model data—often with just a few lines of code. It simplifies complex tasks, supports automation, and grows with your needs.
For beginners and pros alike, Python is more than a tool—it’s a complete environment for solving real-world data problems. If you’re looking to step into data analysis, learning Python is not just a good idea—it’s essential.
Frequently Asked Questions (FAQs)
1. Why is Python so popular for data analysis?
Python is popular because it is easy to learn, highly flexible, and supported by powerful data-focused libraries like pandas, NumPy, and scikit-learn. Its readable syntax allows analysts to focus on insights rather than complex code.
2. Do I need programming experience to use Python for data analysis?
No. Python is beginner-friendly and often recommended as a first programming language. Even users with no prior coding experience can start analyzing data with basic Python concepts.
3. Which Python libraries are most important for data analysis?
The most commonly used libraries include pandas for data manipulation, NumPy for numerical operations, matplotlib and seaborn for visualization, and scikit-learn for machine learning tasks.
4. Can Python handle large datasets?
Yes. Python can efficiently process large datasets using optimized libraries and can also integrate with big data tools and cloud platforms when scalability is required.
5. Is Python suitable for real-time data analysis?
Python supports real-time and near-real-time data analysis through APIs, streaming tools, and automation scripts, making it suitable for dynamic data environments.
6. How long does it take to learn Python for data analysis?
Basic data analysis skills can be learned within a few weeks of consistent practice. Mastery depends on project complexity, but Python’s simplicity speeds up the learning process.
7. Can Python be used for data visualization?
Absolutely. Python offers strong visualization libraries such as matplotlib, seaborn, and plotly, which help transform complex data into clear and insightful charts.
8. Is Python used in professional data analysis roles?
Yes. Python is widely used by data analysts, data scientists, and engineers across industries including finance, healthcare, marketing, and technology.
9. What makes Python better than other data analysis tools?
Python combines ease of use, open-source flexibility, a massive ecosystem, and strong community support, allowing users to perform end-to-end data analysis in one environment.
10. Is learning Python worth it for future careers?
Definitely. As data-driven decision-making continues to grow, Python remains a highly in-demand skill with long-term career value across multiple industries.