


This guide explains how businesses can turn raw data into actionable insights using descriptive, diagnostic, predictive, and prescriptive analytics. It covers techniques, statistical methods, real-time analysis, data governance, ethics, and building a data-driven culture for growth.
Raw data is everywhere, but insights are rare. Companies collect massive amounts of information daily—from customer transactions to website clicks—yet many struggle to transform this data into actionable business intelligence. The difference between thriving companies and those that fall behind often comes down to one factor: how effectively they analyze their data.
Data analysis has evolved from a specialized skill reserved for statisticians to an essential business competency. Modern organizations use sophisticated techniques to uncover patterns, predict trends, and make informed decisions that drive growth. Whether you’re a startup founder or a seasoned executive, understanding these core data analysis methods can unlock opportunities hiding within your company’s information.
This guide explores the most powerful data analysis techniques that businesses across industries are using to gain competitive advantages, improve operations, and better serve their customers.
Descriptive Analytics: Understanding What Happened
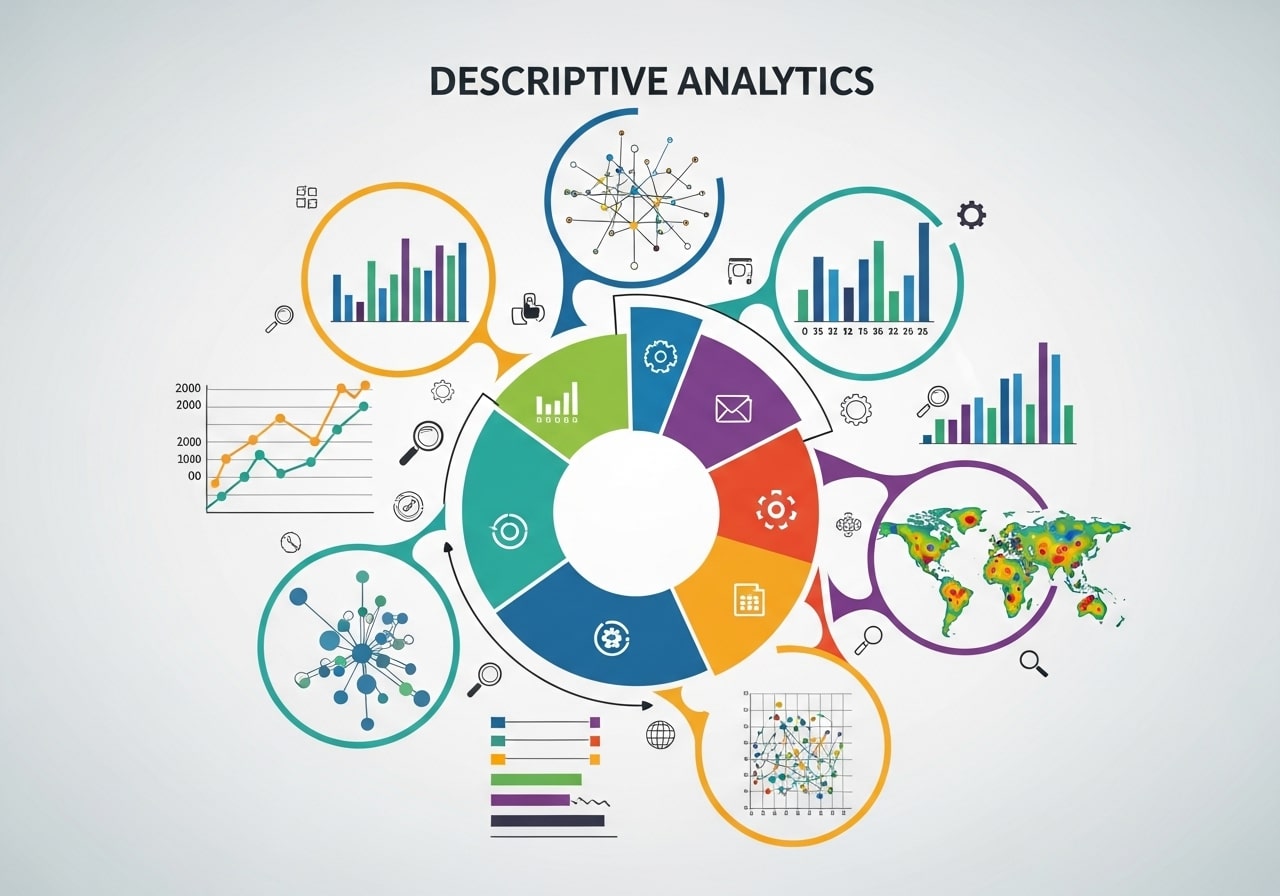
Descriptive analytics forms the foundation of data analysis by summarizing historical data to reveal patterns and trends. This technique answers the fundamental question: “What happened?”
Key Components of Descriptive Analytics
Summary Statistics provide quick insights into your data’s central tendencies, variability, and distribution. Metrics like mean, median, mode, and standard deviation help identify outliers and understand data quality.
Data Visualization transforms complex datasets into charts, graphs, and dashboards that make information accessible to stakeholders. Bar charts, line graphs, and heat maps can reveal trends that might be invisible in spreadsheets.
Trend Analysis examines data over time to identify patterns, seasonal variations, and growth trajectories. Sales teams use this to understand peak periods, while marketing departments track campaign performance across different timeframes.
Business Applications
Retail companies analyze sales data to identify their best-performing products and seasonal trends. Financial institutions examine transaction patterns to detect unusual activity. Healthcare organizations review patient data to understand treatment outcomes and resource utilization.
The power of descriptive analytics lies in its simplicity and immediate applicability. Teams can quickly generate reports, create dashboards, and share insights across the organization without requiring advanced technical skills.
Diagnostic Analytics: Discovering Why Things Happened

While descriptive analytics shows what occurred, diagnostic analytics digs deeper to understand the underlying causes. This technique helps businesses move beyond surface-level observations to identify root causes and contributing factors.
Core Diagnostic Techniques
Correlation Analysis measures the strength and direction of relationships between variables. Understanding these connections helps businesses identify which factors influence their key metrics.
Regression Analysis quantifies how changes in one variable affect another. Companies use this to understand how pricing changes impact sales volume or how marketing spend influences customer acquisition.
Cohort Analysis segments customers or users based on shared characteristics or behaviors during specific time periods. This technique reveals how different groups perform over time and helps identify factors that drive retention or churn.
Practical Implementation
E-commerce businesses use diagnostic analytics to understand why certain products have high return rates. By examining factors like product descriptions, images, pricing, and customer reviews, they can identify specific issues and implement targeted solutions.
Manufacturing companies apply these techniques to understand equipment failures. By analyzing maintenance records, operating conditions, and environmental factors, they can identify patterns that lead to breakdowns and optimize maintenance schedules.
Predictive Analytics: Forecasting Future Outcomes

Predictive analytics leverages historical data and statistical algorithms to forecast future events and trends. This forward-looking approach enables businesses to anticipate challenges and opportunities.
Essential Predictive Methods
Time Series Forecasting analyzes historical data points collected over time to predict future values. Businesses use this for demand planning, inventory management, and financial forecasting.
Machine Learning Models can identify complex patterns in large datasets that traditional statistical methods might miss. These models continuously improve their accuracy as they process more data.
Classification Models predict which category or group a new observation belongs to. Banks use these to assess loan default risk, while marketing teams predict customer segments for targeted campaigns.
Strategic Applications
Supply chain management relies heavily on predictive analytics to anticipate demand fluctuations and optimize inventory levels. Companies can reduce carrying costs while avoiding stockouts by accurately forecasting customer needs.
Customer relationship management teams use predictive models to identify customers at risk of churning. By understanding early warning signs, they can implement retention strategies before valuable customers leave.
Prescriptive Analytics: Recommending Optimal Actions
Prescriptive analytics represents the most advanced form of data analysis, combining predictive insights with optimization techniques to recommend specific actions. This approach answers the question: “What should we do?”
Key Prescriptive Techniques
Optimization Models find the best possible solution given specific constraints and objectives. These models consider multiple variables simultaneously to identify optimal resource allocation, pricing strategies, or operational configurations.
Simulation Analysis models different scenarios to understand potential outcomes under various conditions. Businesses can test strategies virtually before implementing them in the real world.
Decision Trees provide structured frameworks for evaluating different choices and their potential consequences. These visual tools help teams understand the implications of various decisions.
Real-World Implementation
Transportation companies use prescriptive analytics to optimize delivery routes, considering factors like traffic patterns, fuel costs, and delivery windows. Airlines apply these techniques to optimize flight schedules and pricing strategies.
Financial services firms use prescriptive analytics for portfolio optimization, balancing risk and return across different investment options. Marketing teams apply these methods to allocate budgets across channels and campaigns for maximum return on investment.
Statistical Analysis: Building Reliable Insights
Statistical analysis provides the mathematical foundation for drawing reliable conclusions from data. These techniques help businesses distinguish between meaningful patterns and random variations.
Fundamental Statistical Methods
Hypothesis Testing determines whether observed differences or relationships are statistically significant. This prevents businesses from making decisions based on coincidental patterns.
Confidence Intervals quantify the uncertainty around estimates, helping decision-makers understand the reliability of their conclusions.
A/B Testing compares two or more versions of a product, service, or strategy to determine which performs better. This controlled approach minimizes bias and provides clear evidence for decision-making.
Business Value
Product development teams use statistical analysis to validate user preferences and feature effectiveness. By testing different versions with controlled user groups, they can make data-driven decisions about product improvements.
Marketing departments apply statistical methods to measure campaign effectiveness and optimize spending. Understanding confidence intervals helps them distinguish between successful campaigns and random fluctuations in performance.
Data Governance: Ensuring Reliable and Secure Data
Data governance establishes policies, procedures, and standards to manage data consistently across an organization. It ensures data is accurate, accessible, and secure, which is essential for trustworthy analysis. This process includes defining roles, responsibilities, and accountability for data management, as well as implementing data quality checks and compliance measures. Strong data governance reduces errors, prevents misuse, and enhances regulatory compliance. Companies that invest in governance can confidently rely on their analytics initiatives, knowing that insights are based on accurate, standardized, and well-managed data, ultimately improving decision-making and operational efficiency.
Real-Time Analytics: Making Decisions on the Spot
Real-time analytics allows businesses to process and analyze data as it is generated, providing immediate insights for timely decision-making. This technique is particularly valuable in fast-moving industries like e-commerce, finance, and logistics, where delays in analysis can lead to missed opportunities or operational inefficiencies. Streaming data from sensors, transactions, or user interactions can trigger automated responses, optimize processes, or alert teams to urgent issues. By leveraging real-time analytics, organizations can respond proactively to changing conditions, improve customer experiences, and enhance operational agility, turning continuous data flows into actionable intelligence without waiting for historical reporting.
Text and Sentiment Analysis: Understanding Customer Voice
Text and sentiment analysis uses natural language processing (NLP) techniques to interpret and quantify opinions expressed in unstructured data like reviews, social media posts, and surveys. Businesses gain insights into customer satisfaction, emerging trends, and brand perception. Sentiment scoring can reveal positive, negative, or neutral emotions, helping marketing and support teams respond proactively. Beyond customer feedback, these techniques analyze internal communications, product descriptions, and support tickets to identify patterns and potential issues. By understanding the voice of the customer and employees, companies can make informed improvements, tailor communication strategies, and enhance overall engagement and loyalty.
Data Ethics: Balancing Innovation and Responsibility
Data ethics ensures that organizations collect, analyze, and use data responsibly, respecting privacy, fairness, and transparency. Ethical practices prevent misuse, discrimination, or biased decision-making in algorithms and analytics processes. Companies must establish guidelines for consent, anonymization, and secure storage of sensitive data while considering the societal impact of their analytical actions. Adopting data ethics fosters trust among customers, partners, and regulators, enhancing reputation and long-term sustainability. By prioritizing ethical considerations, businesses can innovate with confidence, leveraging data insights while maintaining accountability, protecting stakeholder interests, and ensuring that analytical initiatives align with legal and moral standards.
Getting Started with Data Analysis
Implementing effective data analysis requires both technical capabilities and organizational commitment. Start by identifying your most pressing business questions and the data needed to answer them.
Building Your Foundation
Data Quality must be your first priority. Invest in cleaning, standardizing, and validating your data before applying any analysis techniques. Poor data quality will undermine even the most sophisticated analytical methods.
Tool Selection should align with your team’s technical capabilities and business requirements. Popular options range from user-friendly platforms like Tableau and Power BI to more advanced tools like Python and R.
Skills Development requires ongoing investment in training and education. Consider starting with basic statistical concepts and gradually building more advanced capabilities.
Creating an Analytical Culture
Successful data analysis depends on organizational buy-in and proper change management. Establish clear processes for sharing insights, making data-driven decisions, and measuring the impact of analytical initiatives.
Transforming Data into Competitive Advantage
The businesses that thrive in the next decade will be those that master the art and science of data analysis. These techniques provide the foundation for understanding your customers, optimizing operations, and identifying new opportunities.
Start small but think big. Choose one area where better data analysis could have an immediate impact, implement the appropriate techniques, and measure the results. Success in one area will build momentum for broader analytical initiatives across your organization.
The data your business generates daily contains insights that could transform your operations, improve customer satisfaction, and drive growth. The question isn’t whether you have enough data—it’s whether you’re using the right techniques to unlock its potential.
Frequently Asked Questions (FAQ)
1. What is the difference between descriptive, diagnostic, predictive, and prescriptive analytics?
Descriptive analytics summarizes historical data to show what happened. Diagnostic analytics explores why something occurred. Predictive analytics forecasts future outcomes based on historical patterns, while prescriptive analytics recommends actions to achieve desired results.
2. Why is data quality important before analysis?
Poor data quality—such as missing, inaccurate, or inconsistent information—can lead to misleading insights and flawed business decisions. Cleaning, validating, and standardizing data ensures reliable and actionable results.
3. Do I need advanced tools or programming skills for data analysis?
Not always. Tools like Tableau, Power BI, and Excel allow non-programmers to perform meaningful analysis. However, advanced techniques like machine learning often require knowledge of Python, R, or specialized statistical software.
4. How can small businesses benefit from data analysis?
Even small businesses can leverage data analysis to understand customer behavior, optimize marketing campaigns, manage inventory, and improve decision-making. Starting with a few key metrics can provide significant competitive advantage.
5. What is the role of statistical analysis in business?
Statistical analysis helps distinguish meaningful patterns from random variations. Techniques like hypothesis testing, confidence intervals, and A/B testing guide data-driven decisions and reduce uncertainty.
6. How long does it take to see results from data analysis?
It varies by complexity and organizational readiness. Simple analyses like descriptive dashboards can show results quickly, while predictive or prescriptive projects may take weeks or months to generate actionable insights.
7. Can predictive analytics guarantee accurate forecasts?
No method can guarantee perfect predictions. Predictive analytics provides probabilistic forecasts, helping businesses anticipate trends and make informed decisions, but results are influenced by data quality and external factors.
8. How do I start building a data-driven culture?
Encourage decision-making based on data, provide training, establish processes for sharing insights, and measure outcomes. Leadership support and consistent communication are key to integrating analytics across the organization.
9. Are there industries that benefit most from data analysis?
All industries benefit, but retail, finance, healthcare, logistics, and marketing see immediate value from customer insights, operational optimization, and risk management through data analysis.
10. What is the first step in implementing data analysis in my business?
Start by identifying a specific business problem or goal, ensuring you have the necessary data, and selecting the appropriate analysis techniques and tools to generate actionable insights.


