The price of advanced analytics tools can be hard to figure out, and Glassbox Analytics is no exception. Glassbox is a leader in their industry, known for strong offerings that enable organizations to maximize their digital experiences by gaining insights needed for customer behavior analysis. But you may be wondering, how much is Glassbox Analytics, and what goes into determining its costs?
This post will systematically dive into what you need to know about the cost of Glassbox Analytics—what contributes to its pricing, its multiple pricing approaches, and how it stacks up against other analytics tools. We’ll also provide advice on how to get the most value out of it, so you’ll know the investment is worthwhile for your business.
Understanding Glassbox Analytics Cost
Before investing in a premium digital experience platform, it’s important to understand Glassbox Analytics cost. Glassbox uses a customized pricing model based on traffic volume, feature requirements, and deployment preferences. Knowing how these factors influence pricing helps businesses determine whether Glassbox fits their budget while delivering measurable value and actionable customer insights.
4 Things That Will Determine Cost of Glassbox
Let’s look at what makes up Glassbox Analytics pricing before moving on to pricing tiers. The price at Glassbox is calculated by these factors:
1. Scale of Usage
Bigger customers or those with lots of traffic to their websites or apps generally pay more. Prices are frequently based on user sessions or data points.
2. Features & Functionalities
Glassbox offers features ranging from basic analytics to advanced capabilities such as AI-driven insights and anomaly detection. The more features you need, the larger your subscription level and cost.
3. Deployment Method
Glassbox is available both in the cloud and on-premises. On-premises installations can be more expensive due to extra infrastructure and management.
4. Contract Length
Longer contracts may allow for cheaper pricing. Monthly plans tend to be more expensive per month than annual contracts.
Support & Customization
Premium support, custom analytics dashboards, and additional onboarding services may also increase total cost.
Glassbox Analytics Cost Pricing Tiers

Glassbox doesn’t list fixed prices publicly; pricing adjusts based on service needs and implementation scale. Typical tiers include:
Basic Tier
-
Best for: Small businesses or startups
-
Features: Core analytics, simplified session replay, beginner-level reports
-
Cost: Starting at a few thousand dollars per year, depending on data usage and sessions
Professional Tier
-
Best for: Larger businesses wanting more analytics functions
-
Features: Advanced web analytics, AI-based insights, heatmapping, multi-device analytics
-
Cost: Tens of thousands annually; varies with traffic volume
Enterprise Tier
-
Best for: Large companies or those with high-traffic websites
-
Features: Full access to all features, personalized dashboards, dedicated account manager, priority support, on-premises installation
-
Cost: Can reach hundreds of thousands annually depending on scale
Like most SaaS companies, Glassbox requires contacting their sales team for a custom quote based on your specific requirements.
Comparison With Other Analytics Tools
Glassbox is innovative, but not alone. Here’s how it compares to other popular platforms:
Hotjar
-
Focus: User activity analytics and heat maps
-
Price: From $39/month basic plans
-
Differences: Great for small companies but lacks advanced AI features found in Glassbox
Adobe Analytics
-
Focus: Large-scale digital analytics with robust reporting
-
Cost: Comparable or higher than Glassbox; enterprise plans can reach six figures annually
-
Differences: Strong dashboards and integrations but lacks session replay and real-time depth like Glassbox
Google Analytics 360
-
Focus: Enterprise-grade analytics in the Google ecosystem
-
Price: Starting at $150,000 per year
-
Differences: Strong with Google Ads integration but not focused on digital experience optimization like Glassbox
Glassbox’s real-time analytics, advanced customer insights, and AI capabilities make it ideal for businesses focusing on digital experience optimization.
Introduction to Google Analytics Data Analysis
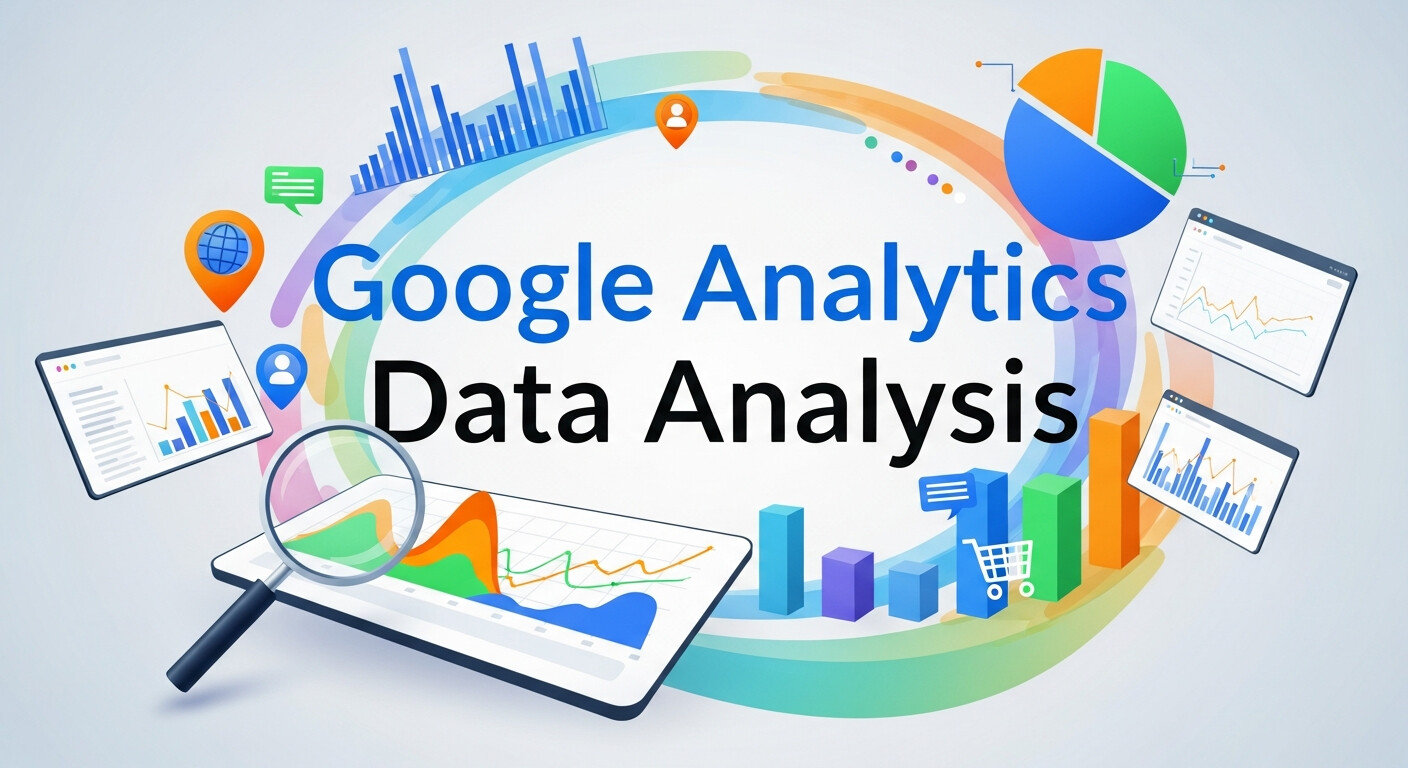
Google Analytics Data Analysis is a cornerstone for understanding customer behavior on your website. By tracking user interactions, conversions, and traffic sources, businesses can uncover actionable insights to improve marketing strategies. It allows companies to evaluate which campaigns drive the most value and identify potential bottlenecks. Through effective Google Analytics Data Analysis, you can segment audiences, monitor trends over time, and assess website performance. Combining this with other tools like CRM systems or marketing automation enhances visibility. Learning how to interpret this data helps businesses make informed decisions, optimize campaigns, and increase ROI. Mastering Google Analytics Data Analysis is essential for data-driven digital marketing success.
Why Data Marketing Analytics Matters
Data Marketing Analytics empowers businesses to make smarter, evidence-based marketing decisions. By analyzing campaign performance, customer preferences, and purchase behavior, marketers can allocate resources more efficiently. Integrating Data Marketing Analytics with tools like Google Analytics or Excel provides a holistic view of performance, highlighting opportunities for growth and cost optimization. It’s not just about reporting metrics; it’s about uncovering patterns and predicting customer behavior. Companies that use Data Marketing Analytics effectively gain a competitive edge by personalizing campaigns and targeting the right audience. This approach reduces wasted spend and increases engagement, making Data Marketing Analytics indispensable for modern marketing strategies.
How to Install Data Analysis in Excel
Excel is a powerful tool for performing data analysis without complex software. To install Data Analysis in Excel, start by opening Excel, navigating to the “File” menu, and selecting “Options.” Then click “Add-ins,” choose “Excel Add-ins,” and check “Analysis ToolPak.” Once activated, you can access statistical tools under the “Data” tab, including regression, ANOVA, and descriptive statistics. Installing Data Analysis in Excel allows marketers and analysts to process large datasets efficiently, visualize trends, and perform predictive analysis. It’s a practical way to combine spreadsheet flexibility with advanced analytics techniques. This feature is essential for anyone seeking to transform raw data into actionable insights.
Leveraging Google Analytics Data Analysis for Marketing Strategy
Google Analytics Data Analysis is more than just tracking numbers—it’s about optimizing your marketing strategy. By examining metrics like bounce rates, session duration, and traffic channels, you can determine which campaigns resonate with your audience. Pairing this analysis with Data Marketing Analytics ensures you understand both the performance and the context of customer actions. Insights from Google Analytics Data Analysis help tailor content, improve user experience, and increase conversions. Businesses can also integrate this data into Excel for deeper statistical analysis. Regular monitoring of trends and anomalies allows marketing teams to respond quickly, making Google Analytics Data Analysis a central pillar of modern marketing optimization.
Combining Data Marketing Analytics with Excel

Data Marketing Analytics becomes even more powerful when combined with Excel. By exporting marketing data into spreadsheets, you can perform advanced calculations, pivot tables, and scenario analysis. Installing Data Analysis in Excel ensures access to tools like regression and correlation, which help identify patterns and predict future performance. Businesses can track campaign ROI, segment audiences, and visualize key performance indicators with charts and graphs. This integration provides both flexibility and precision, allowing marketers to dive deep into metrics without relying solely on online dashboards. Using Excel alongside Data Marketing Analytics enhances decision-making and ensures strategies are based on actionable, data-driven insights.
Common Metrics Tracked in Google Analytics Data Analysis
In Google Analytics Data Analysis, several metrics are crucial for assessing website performance. These include user sessions, page views, bounce rates, conversion rates, and average session duration. Combining these with Data Marketing Analytics offers a full picture of campaign effectiveness, showing which channels drive engagement and revenue. Businesses can also export this data into Excel, where installing Data Analysis in Excel allows for trend detection, forecasting, and scenario modeling. By tracking these metrics consistently, companies can identify strengths, weaknesses, and opportunities for improvement. Using Google Analytics Data Analysis ensures marketing strategies are informed by accurate, actionable data.
Benefits of Using Data Marketing Analytics for Businesses
Data Marketing Analytics provides businesses with a competitive edge by transforming raw data into insights. By tracking customer interactions, analyzing trends, and forecasting behavior, companies can make informed decisions that improve engagement and revenue. Integrating Data Marketing Analytics with Google Analytics Data Analysis or installing Data Analysis in Excel allows for deeper insights and visualizations. Marketers can optimize campaigns, allocate budgets effectively, and tailor content to customer preferences. Using this approach minimizes guesswork, ensures decisions are backed by data, and enhances ROI. Businesses that adopt Data Marketing Analytics gain actionable insights that guide strategic planning and drive measurable results.
How to Get a Custom Quote From Glassbox
Since Glassbox offers a complex, industry-specific solution, you should contact their sales team for a custom quote. To prepare for your inquiry, have the following info ready:
-
Rough website and mobile app traffic volumes
-
Desired product features
-
Deployment preference (cloud or on-premises)
-
Expected contract duration
During the call, Glassbox will assess your business and budget to recommend the best solution and provide accurate pricing.
How to Get the Most Out of Glassbox Analytics
Maximize your investment after signing up by:
Define Clear Goals
Set specific objectives like increasing conversions or reducing churn to focus your use of Glassbox.
Train Your Team
Ensure your team is trained on Glassbox tools; many platforms offer webinars or training sessions.
Integrate with Other Analytics Software
Connect Glassbox with your tech stack (CRMs, marketing automation) to get a full view of the digital customer experience.
Leverage AI Insights
Use AI-powered insights to detect trends, predict behavior, and fix small issues before they escalate.
Regularly Assess Your ROI
Monitor the value and results you achieve from Glassbox to ensure continued benefit.
Is Glassbox Really Worth It?

Whether Glassbox Analytics is right for your business depends on your needs. If you have high digital traffic and seek frictionless user experience optimization, Glassbox’s powerful tools and real-time insights can be invaluable.
Smaller businesses on a budget may find basic tools like Hotjar or Google Analytics sufficient.
If you think Glassbox Analytics can improve your customer experience strategy, contact their team today for a personalized quote. It could be the tool that saves your digital experience. If you’re exploring analytics tools, it helps to know how to download and implement Google Analytics code quickly.
Getting Started with Installing Data Analysis in Excel
Installing Data Analysis in Excel is simple and opens the door to advanced analytics. Begin by opening Excel, selecting “File > Options > Add-ins,” then checking “Analysis ToolPak” under Add-ins. This feature provides tools like descriptive statistics, correlation, regression, and more. By installing Data Analysis in Excel, businesses can complement Google Analytics Data Analysis or Data Marketing Analytics insights, performing deeper offline analysis. It’s ideal for generating charts, running simulations, or creating custom reports. Mastering this functionality allows marketers and analysts to uncover hidden trends, optimize campaigns, and make informed decisions based on solid, quantifiable data.
Frequently Asked Questions (FAQ)
1. How much does Glassbox Analytics cost?
Glassbox Analytics does not offer fixed public pricing. The cost typically depends on traffic volume, required features, deployment method, and contract length. Pricing can range from a few thousand dollars per year for smaller setups to hundreds of thousands annually for enterprise-level implementations.
2. Does Glassbox Analytics offer a free trial?
Glassbox generally does not provide a standard free trial. However, businesses can request a demo to explore features and understand how the platform fits their needs before committing to a paid plan.
3. What factors most impact Glassbox Analytics pricing?
The main pricing factors include website or app traffic volume, number of sessions recorded, feature requirements, deployment type (cloud or on-premises), contract duration, and any additional support or customization services.
4. Is Glassbox Analytics suitable for small businesses?
Glassbox Analytics is primarily designed for mid-sized to enterprise-level organizations with significant digital traffic. Small businesses with limited budgets may find lighter tools like Hotjar or Google Analytics more cost-effective.
5. How does Glassbox Analytics compare to Hotjar in terms of cost?
Glassbox is significantly more expensive than Hotjar. While Hotjar offers affordable plans starting at low monthly rates, Glassbox provides enterprise-grade features such as AI-driven insights, real-time session replay, and advanced digital experience optimization.
6. Is Glassbox Analytics more expensive than Google Analytics 360?
Pricing can be comparable depending on usage. Google Analytics 360 starts at around $150,000 per year, while Glassbox pricing varies based on traffic and features. Glassbox focuses more on user experience analytics rather than traditional reporting.
7. Can Glassbox Analytics pricing be negotiated?
Yes. Since Glassbox offers custom pricing, businesses may be able to negotiate costs based on contract length, feature requirements, and usage volume during discussions with the sales team.
8. Does Glassbox Analytics charge based on sessions or users?
Glassbox pricing is commonly based on the number of user sessions or data volume processed, rather than individual user seats.
9. Is Glassbox Analytics worth the investment?
For businesses with high digital traffic and a strong focus on optimizing customer experience, Glassbox can deliver significant ROI through improved conversions, reduced friction, and faster issue resolution. For smaller teams, the cost may outweigh the benefits.
10. How can I get an exact Glassbox Analytics price?
To get accurate pricing, you’ll need to contact Glassbox directly and provide details about your traffic levels, desired features, deployment preferences, and contract duration.