The very decisions and innovations that shape our industries are driven by data. Focusing on optimizing a process, identifying areas for growth, or simply trying to understand complicated trends, the most important part to your success is how you handle. The best data analysis tools are transformative for how business professionals and tech enthusiasts can help you do your job and make a difference.
In this guide, we will take a look at some of the major data analysis tools and their respective categories to guide you in finding the tools that fit you best. You will also discover how these are more than tools; they are the doorways unlocking the true power of your data.
Why Data Analysis is More Important Than Ever

Data analysis skills are no longer just a “nice-to-have” — they are essential for businesses and organizations that want to succeed in competitive markets. Data-driven companies are 23 times more likely to get customers and 19 times more likely to be profitable and according to Forbes.
Whether it’s predicting budgets or identifying consumer behavior, accurate data analysis gives power to decision-makers. Of course, none of this is possible without the proper tools. These tools convert raw data into actionable insights, save you time, improve accuracy, and allow for deeper exploration.
Essential Data Analysis Tools You Should Know About
There are countless tools available in the market for data analysis, each serving different needs and expertise levels. Here are some of the key ones that all analysts or business professionals should think about:
1. Microsoft Excel
Excel has long been the king of data tools and is a fundamental tool for both beginners and seasoned professionals alike. It is fast for inputting, organizing, and performing sophisticated operations with functions and pivot tables. It’s simple at first glance, but its powerful features are what make it a must-have for many.
2. Google Sheets
Google Sheets moves Excel’s collaborative potential to the cloud. In addition to rudimentary data analysis, it offers add-ons like Google Data Studio to bring visualization with a notch up, especially for the teams who are sharing data at the same time in a shared manner.
3. Tableau
Renowned for its visualization capabilities, Tableau enables users to turn raw data into interactive and shareable dashboards. It connects seamlessly with various databases and helps make data storytelling as impactful as possible.
4. R
An open-source statistical programming language, R is a favorite among data scientists and statisticians. It excels in handling statistical analysis, big data, and creating intricate visualizations. Packages like ggplot2 and dplyr streamline even the most complex analyses.
5. Python
Python offers unmatched versatility in the data analysis world. Libraries such as Pandas for data manipulation and Matplotlib or Seaborn for visualization provide powerful solutions for analyzing massive datasets.
Diving Deeper into Tool Categories
To better understand the landscape of data analysis tools, it helps to categorize them. Below, we break down the three most common categories:
Statistical Analysis Tools
Statistical tools like R, SAS, and SPSS help organizations make sense of large datasets by performing advanced statistical operations. These tools are essential when working on predictive analysis, regression models, or testing hypotheses.
- Best for: Data analysts, researchers, and statisticians analyzing intricate datasets.
- Features to note: Models, simulations, hypothesis testing, and data regression.
Data Visualization Tools
When it comes to presenting your data in a compelling way, visualization tools are your go-to resource. Tools like Tableau, Power BI, and Google Data Studio bring patterns and insights to life, making them easier to communicate with non-technical stakeholders.
- Best for: Business professionals, marketers, and consultants creating client-ready presentations.
- Features to note: Custom dashboards, interactivity, and drag-and-drop interfaces.
All-in-One Platforms
These tools combine multiple features, such as analysis, visualization, and machine learning integration, into a single platform. Excel, Python, and SQL-based tools like Apache Superset often fit into this category. They are especially useful for teams that need to streamline their data workflows.
- Best for: Enterprises managing large-scale operations.
- Features to note: Data cleaning, machine learning, and seamless model integration.
How to Choose the Right Data Analysis Tools for Your Needs
With so many options, how do you determine which tools are best for you? Here are the key factors to consider:
1. Identify Your Goals
Are you looking to analyze trends? Create predictive models? Streamline reporting? Your end goal should guide your tool selection.
2. Assess Ease of Use
If you’re a beginner, tools with intuitive interfaces (like Tableau or Google Sheets) can make a huge difference. More experienced users may prefer the complexity and flexibility of R or Python.
3. Consider Scalability
For small projects, free tools like Google Sheets might suffice. However, larger datasets demand scalable solutions like Power BI or Apache Hadoop.
4. Cost and Licensing
Many tools are free or open-source (e.g., Python, R), while others like Tableau or SAS require licensing or subscriptions. Always weigh the cost against the tool’s functionality and ROI.
5. Integration with Your Workflow
Check if the tool integrates easily with existing systems, such as databases, CRMs, or cloud platforms. Seamless integration reduces friction and saves time.
6. Community & Support
Popular tools generally have robust user communities and resources. Tools like Python and R, for instance, have extensive libraries and forums that can provide guidance for troubleshooting or ambitious projects.
Leveraging Unified Customer Insights
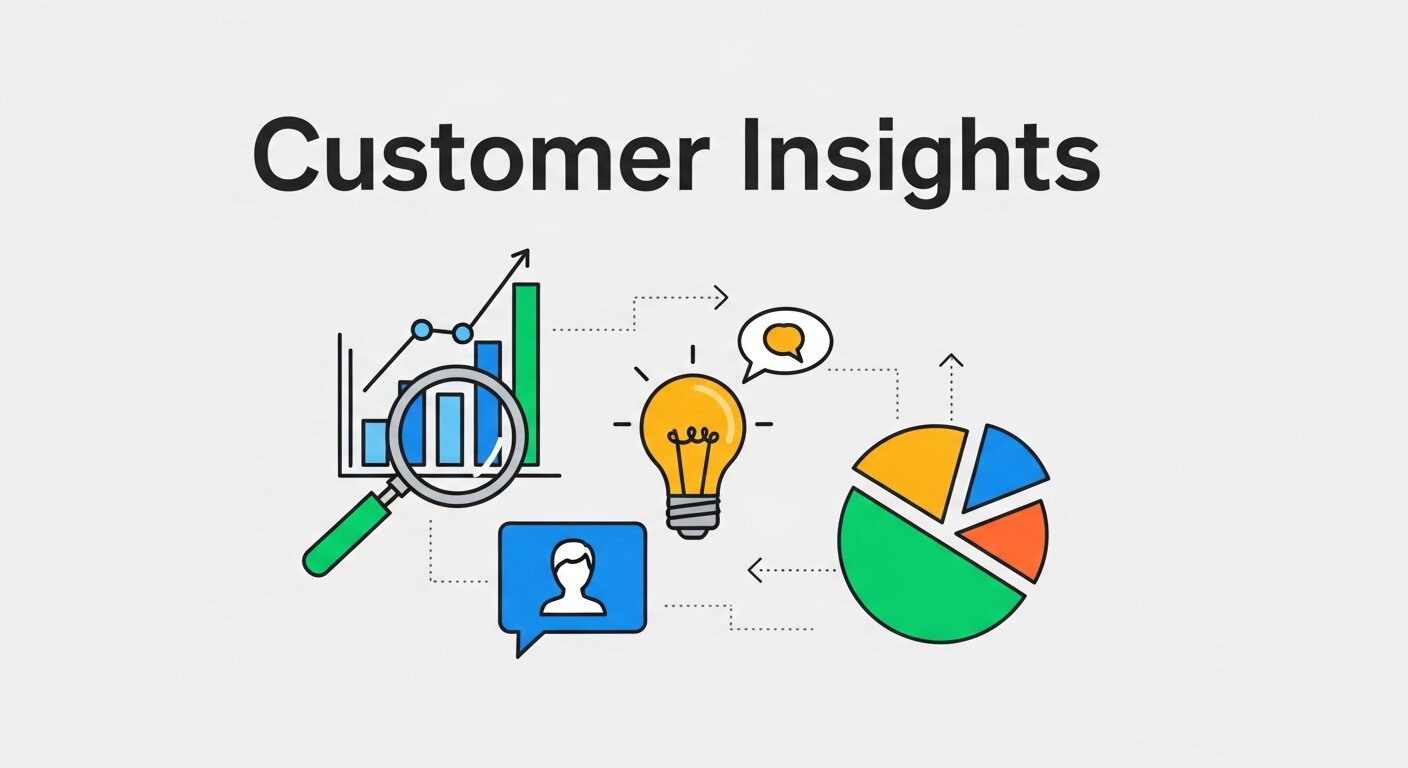
Modern businesses rely heavily on unified data ecosystems to understand their audiences better. A powerful approach involves integrating transactional, behavioral, and demographic information into a centralized system. This is where Customer Data Platforms play a crucial role. They gather data from multiple sources such as websites, CRMs, email campaigns, and social media to create a single, consistent customer profile. With this unified view, companies can personalize communication, improve customer experiences, and increase retention rates. Instead of relying on fragmented datasets, organizations can make more precise decisions backed by real-time intelligence. As competition grows across industries, having a centralized data strategy ensures marketing, sales, and support teams work with aligned insights that drive measurable business growth.
Strengthening Decision-Making with Analytical Methods
Data alone does not create value unless it is properly examined and interpreted. Businesses must apply structured Data Analysis Techniques to uncover patterns, correlations, and performance gaps. These techniques include descriptive analysis to understand past performance, diagnostic analysis to determine why trends occurred, predictive modeling to forecast outcomes, and prescriptive analysis to recommend actions. By implementing these structured approaches, organizations reduce uncertainty and improve strategic planning. Strong analytical frameworks also support risk management, operational optimization, and performance benchmarking. Companies that invest in advanced analytical skills are better positioned to respond quickly to market changes and evolving customer expectations, ensuring sustainable growth in increasingly competitive environments.
Transforming Campaign Performance Through Analytics
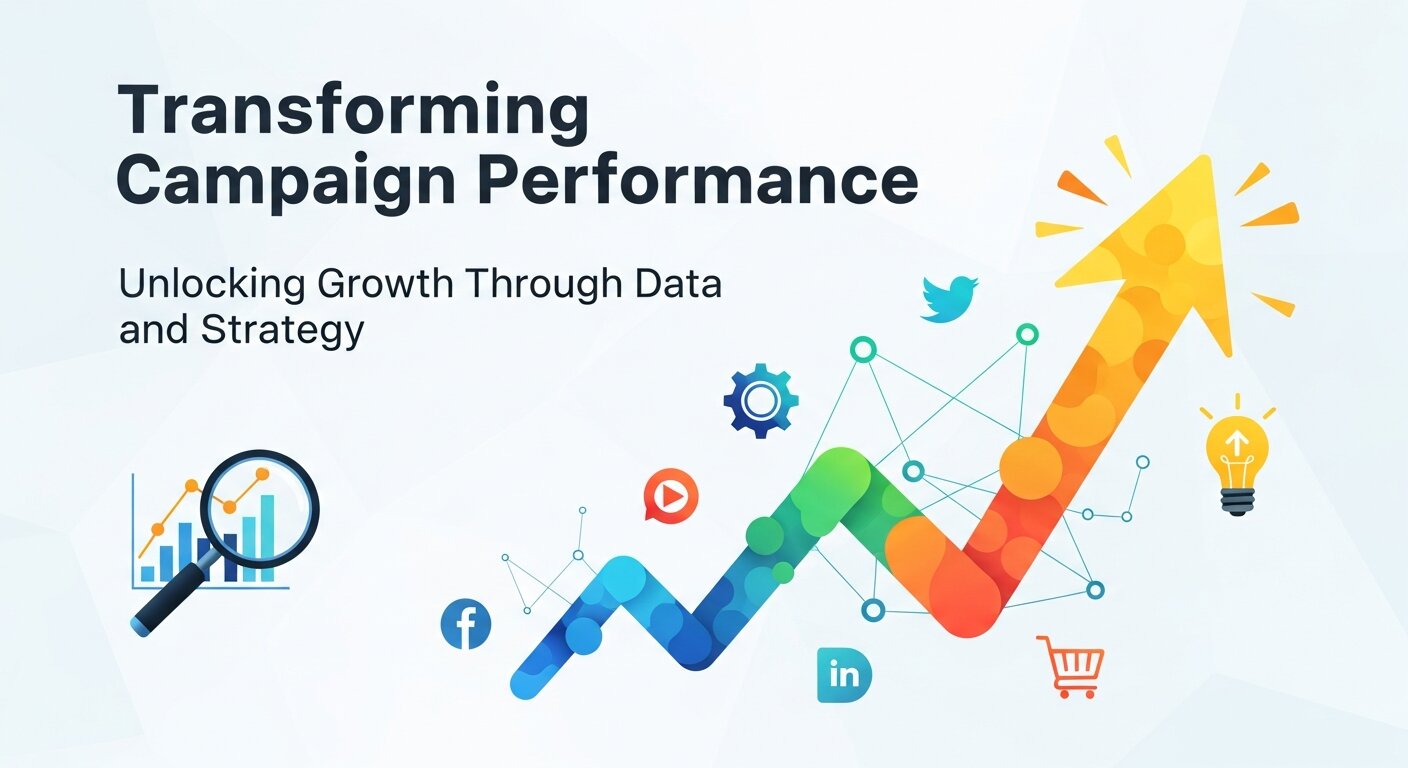
Marketing is no longer driven by assumptions; it is guided by measurable insights. With the rise of digital platforms, Data Marketing Analytics has become essential for tracking campaign effectiveness, customer engagement, and return on investment. Businesses can monitor metrics such as conversion rates, click-through rates, and customer acquisition costs to refine strategies continuously. By analyzing user journeys and behavioral data, marketers can tailor personalized campaigns that resonate with specific audience segments. This analytical approach minimizes wasted ad spend and maximizes impact. As marketing channels expand, companies that leverage data-backed performance insights can create highly targeted initiatives that strengthen brand loyalty and accelerate revenue growth.
Enhancing Operational Efficiency with Smart Data Workflows
Efficient operations depend on accurate and timely information. Organizations that build streamlined data workflows can eliminate redundancies, reduce manual errors, and accelerate reporting processes. Automation tools, cloud-based storage systems, and integrated dashboards allow teams to access real-time data without delays. When departments operate within a connected data infrastructure, collaboration improves significantly. Finance, marketing, and operations teams can align their strategies using shared metrics and performance indicators. This unified workflow not only saves time but also ensures consistent reporting standards across the organization. Companies that prioritize structured data governance and workflow optimization gain a competitive edge through faster decision cycles and improved overall productivity.
Driving Innovation with Predictive Intelligence
Predictive intelligence empowers organizations to anticipate trends before they fully emerge. By analyzing historical data and identifying recurring patterns, businesses can forecast demand, optimize inventory, and anticipate customer preferences. Machine learning models enhance this capability by continuously learning from new data inputs and refining predictions over time. This proactive approach enables companies to stay ahead of competitors rather than reacting to market changes. Predictive systems also support risk assessment by identifying anomalies and potential disruptions early. As industries become increasingly data-driven, organizations that embrace forward-looking analytics will lead innovation, improve customer satisfaction, and build resilient strategies capable of adapting to future uncertainties.
Building a Data-Driven Organizational Culture
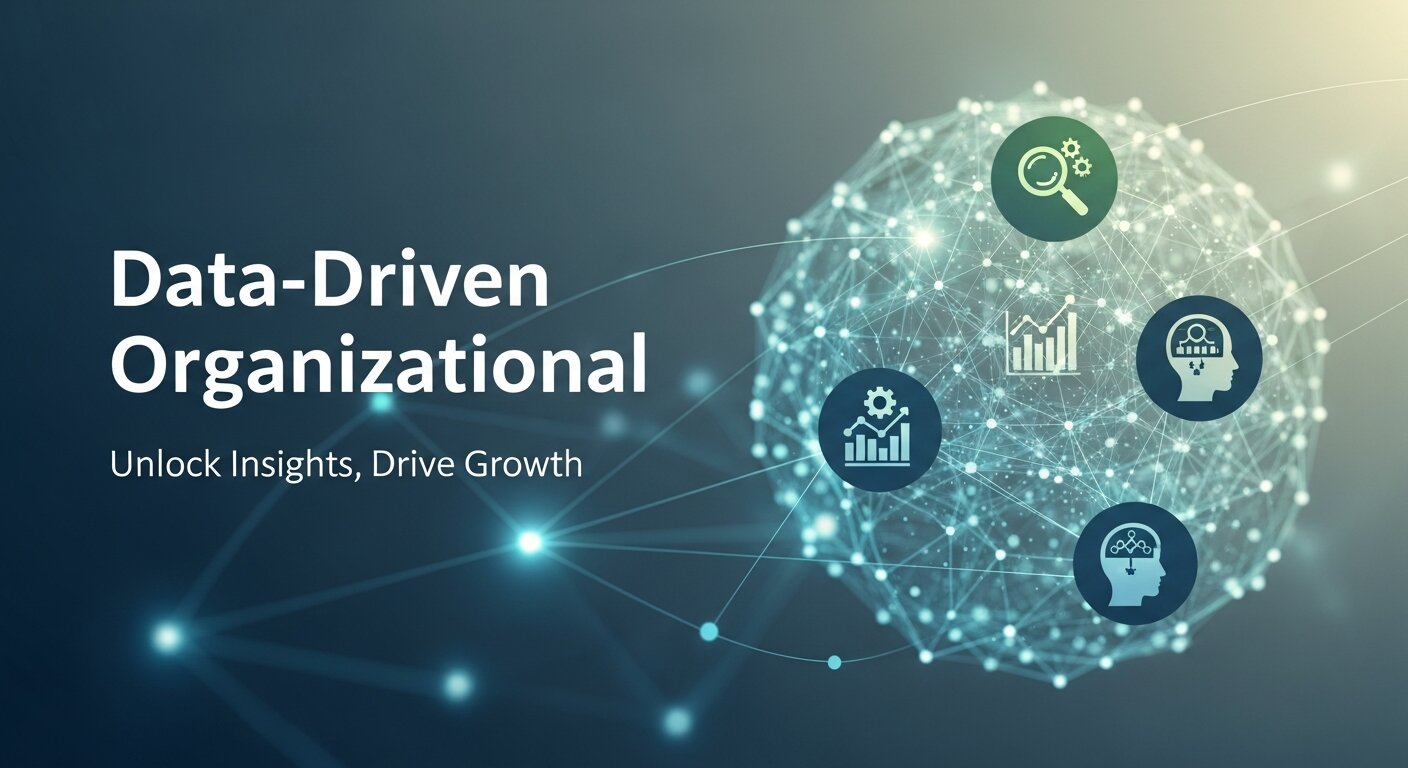
Technology alone cannot guarantee analytical success; culture plays a critical role. Organizations must foster a mindset where decisions are guided by evidence rather than intuition. This involves training employees to interpret dashboards, understand performance metrics, and question assumptions with data-backed reasoning. Leadership must encourage transparency, continuous learning, and experimentation. When teams feel confident using analytical tools, collaboration becomes more strategic and goal-oriented. A strong data culture also promotes accountability, as performance indicators are clearly defined and measurable. Over time, this environment nurtures innovation and adaptability. Businesses that embed data literacy into their core values create sustainable growth and maintain long-term competitive advantage.
The Future of Data Analysis and Tools
Now, with the advancements of AI and machine learning, the future of data processing is becoming more automated and intelligent. AI-powered BI platforms and natural language processing (NLP) systems have made it possible to extract faster, deeper, and more intuitive insights.
Edge computing is making tools faster and easier to use, processing data in real-time so that the enterprise can make informed decisions. As the data landscape evolves, those with a broad and evolving set of data tools will be well-positioned for success ahead.
Empower Your Data with the Right Tools
Finding the right data analysis tools doesn’t just optimize the way you work; it shapes the way you process and engage with information. Data analysis contains tools such as Tableau for visualization, R for statistical analysis, and Python out of versatility, tapping in to each dataset for an entirely new potential.[2]
But remember, tools are only one side of the coin. (The commitment to exploration and learning.) Take baby steps, iterate regularly, and continuously stretch the limits of what can be done with your data.
Do you want to go to the next level with your data game? Now go take a look at these tools and make educated decisions confidently!
Frequently Asked Questions (FAQ)
1. What are data analysis tools?
Data analysis tools are software applications and programming platforms used to collect, clean, process, analyze, and visualize data. Tools like Microsoft Excel, Tableau, Python, and R help transform raw data into meaningful insights that support smarter decision-making.
2. Why is data analysis important for businesses?
Data analysis enables businesses to make informed decisions based on facts rather than assumptions. It helps identify trends, understand customer behavior, optimize operations, reduce costs, and increase profitability in competitive markets.
3. Which data analysis tool is best for beginners?
For beginners, Microsoft Excel and Google Sheets are ideal starting points. They offer user-friendly interfaces, built-in formulas, and simple visualization features without requiring programming knowledge.
4. What is the difference between Python and R in data analysis?
Python is a versatile programming language widely used for data analysis, machine learning, automation, and application development. R is specifically designed for statistical computing and excels in advanced statistical modeling and research-focused analysis. The choice depends on project requirements and user preferences.
5. What are data visualization tools used for?
Data visualization tools convert complex datasets into charts, dashboards, and interactive reports. Tools like Tableau and Microsoft Power BI make it easier to communicate insights clearly to stakeholders without technical backgrounds.
6. Are free data analysis tools good enough for professional use?
Yes, many free and open-source tools such as Python and R are powerful enough for professional and enterprise-level projects. However, some organizations may prefer paid tools for advanced features, dedicated support, and seamless integration.
7. Do I need coding skills to become a data analyst?
Coding skills are not mandatory to start with basic data analysis. Tools like Microsoft Excel allow users to perform substantial analysis without programming. However, learning coding languages like Python can significantly expand career opportunities and analytical capabilities.
8. How do I choose the right data analysis tool?
Choosing the right tool depends on your goals, technical expertise, budget, and the size of your datasets. Small projects may only require spreadsheet tools, while larger and more complex tasks may benefit from advanced platforms like Tableau or programming environments.
9. What is the role of SQL in data analysis?
SQL is used to query, manage, and manipulate structured data stored in databases. It allows analysts to extract specific data efficiently and prepare it for further analysis using tools such as Microsoft Power BI or Tableau.
10. What is the future of data analysis tools?
The future of data analysis tools lies in AI integration, automation, and real-time processing. Modern platforms increasingly combine analytics with machine learning and natural language capabilities, making data insights faster, smarter, and more accessible to users across all industries.