When it comes to approaching a data analytics project, the perennial question that comes up among professionals is whether to begin with exploratory data analysis or by making a dive right into business logic. They’re both key parts of effective data analysis, but when you do that work can greatly influence how efficiently and effectively your project proceeds. This blog will look at both the purpose of EDA and business logic in analytics, outline its pros and cons, and provide general examples to help you make an educated decision.
Understanding EDA and Business Logic in Data Analytics
What is EDA and Why is it Important?
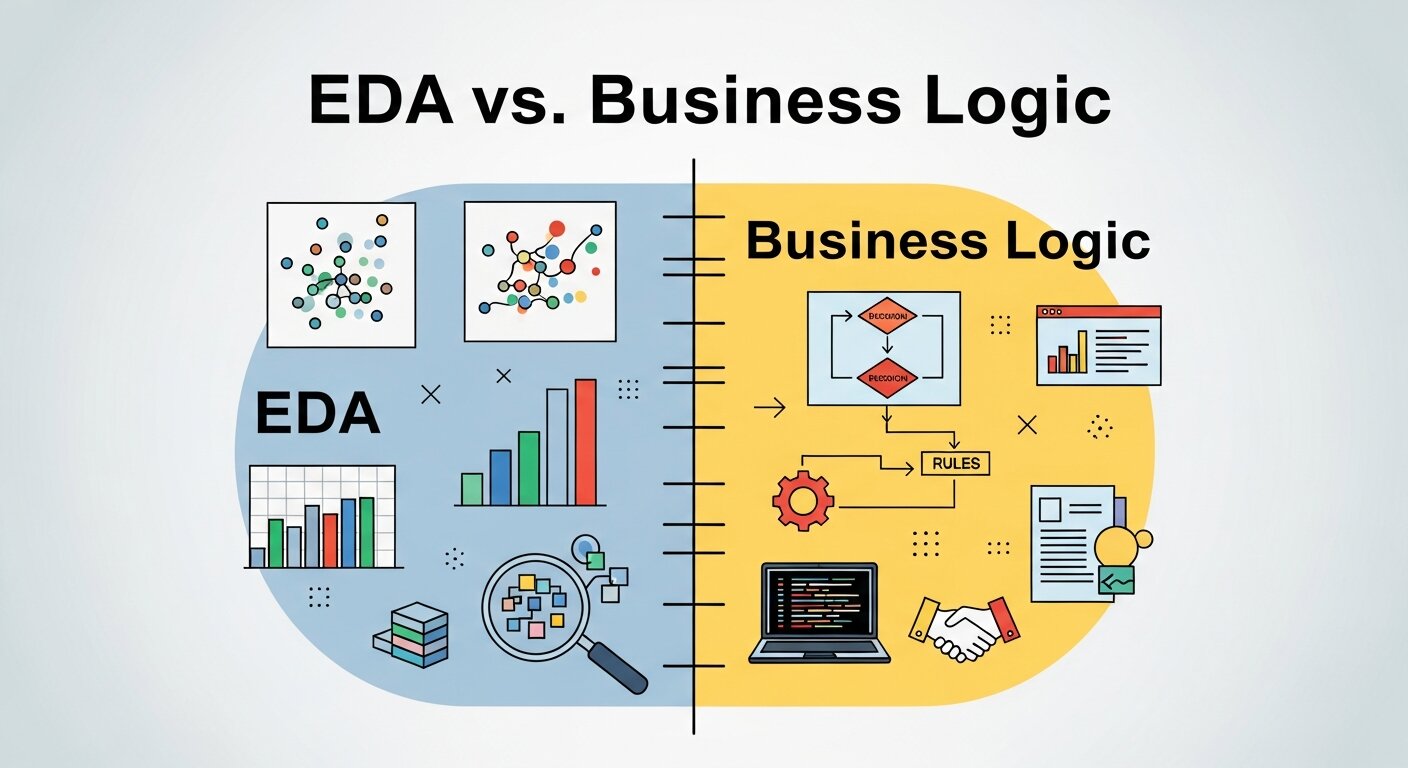
Exploratory Data Analysis involves investigating and summarizing datasets to uncover patterns, anomalies, and insights. It is often the first step that data scientists and analysts take after obtaining a dataset.
Core Goals of EDA:
- Detect Trends and Patterns: Identify relationships between variables using visualizations like scatter plots, histograms, and box plots.
- Spot Anomalies: Highlight outliers or missing data points that could skew results.
- Guide Hypotheses: Provide baseline insights that lead to more informed questions or predictive models.
Tools Commonly Used in EDA:
- Python libraries like Pandas, NumPy, and Matplotlib.
- R programming for statistical analysis.
- Visual tools like Tableau or Power BI.
Exploratory Data Analysis is crucial because it allows analysts to “get to know” the data before applying complex algorithms or decision-making processes. Without a proper EDA phase, you risk making false assumptions or basing decisions on poorly understood data.
What is Business Logic and Why is it Important?
Business logic refers to the rules and processes that guide how raw data should be processed, structured, or interpreted to match an organization’s goals. It involves understanding the context of the business and designing data solutions to meet specific needs.
Core Components of Business Logic:
- Domain Knowledge: Understanding the business context (e.g., e-commerce, healthcare, banking) to interpret data meaningfully.
- Data Transformation Rules: Establishing how raw data should be cleaned, aggregated, or manipulated before analysis (e.g., converting raw timestamps into sales seasons).
- Key Metrics Definitions: Defining KPIs, such as customer lifetime value (CLV) or conversion rates, that align with business objectives.
Business logic ensures that your analysis serves a purpose rather than being data for data’s sake. It keeps analytics efforts aligned with actionable business outcomes and provides clarity on what the data is intended to achieve.
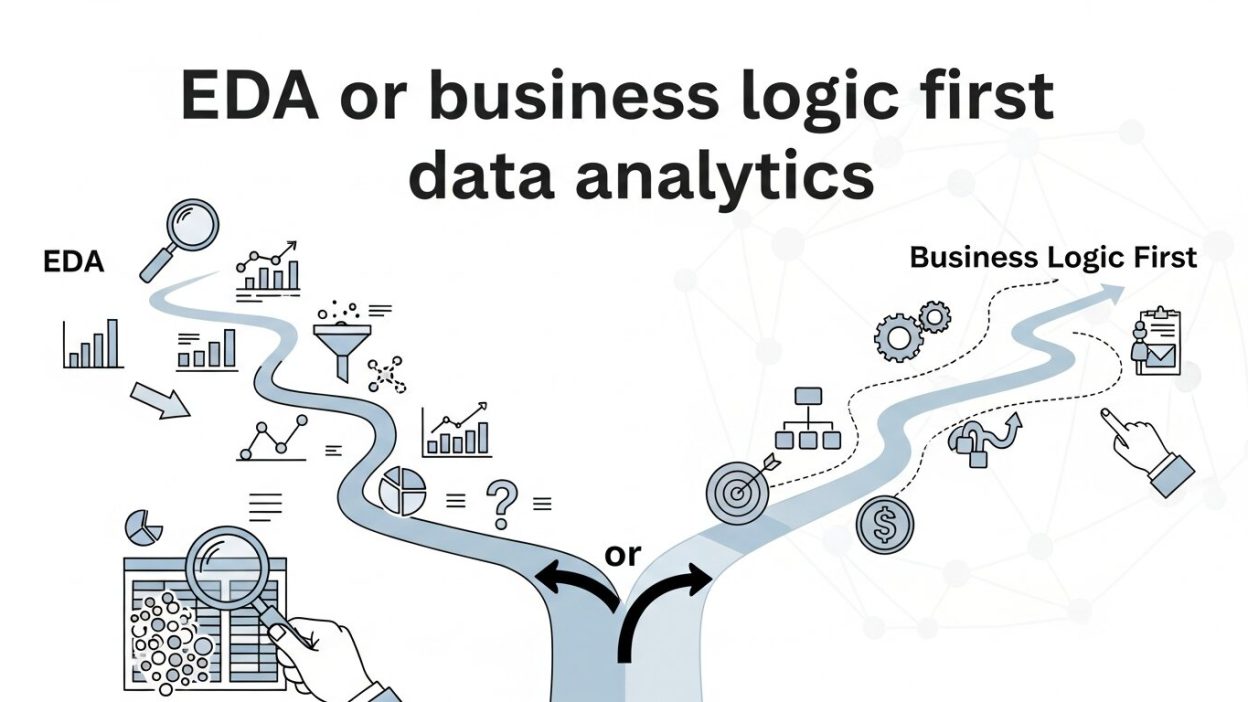
EDA vs. Business Logic: Which Should Come First?
Determining whether to conduct EDA or address business logic first depends heavily on the nature of your project and its objectives. Here’s a head-to-head comparison:
1. Data Familiarity
- EDA Typically Comes First if you’re working with a new dataset and need to understand its structure, detect anomalies, or evaluate data quality before applying business logic.
- Business Logic Often Takes Priority if you’re working with pre-defined datasets or ongoing projects where the business rules are already well-established.
2. Project Objectives
- EDA is Ideal for hypothesis-driven research, where you need to explore relationships and trends before defining rules.
- Business Logic is Essential for operational tasks, like generating monthly reports or automating dashboards.
3. Flexibility vs. Precision
- EDA Focuses on Flexibility, enabling you to try various analyses and uncover unexpected patterns.
- Business Logic Brings Precision, ensuring results align with predefined goals, such as increasing profits or streamlining processes.
4. Stakeholder Expectations
- EDA Offers Quick Insights for exploratory questions like “What does the data say about sales trends?”
- Business Logic Provides Consistency for repetitive tasks such as reporting KPIs to stakeholders.
5. Potential Risks
- Starting with Exploratory Data Analysis without understanding business logic could lead to misinterpreted insights if you’re unaware of nuanced business rules.
- Starting with Business Logic without exploring the dataset could blind you to unexpected anomalies or insights.
Real-World Examples of EDA and Business Logic in Action
Example 1: EDA First
Imagine you’re tasked with analyzing customer purchasing patterns for an e-commerce store. Starting with Exploratory Data Analysis can help you:
- Identify peak purchasing times.
- Spot items frequently bought together (e.g., product bundling opportunities).
- Detect unusual spikes in sales that might warrant further investigation.
After EDA, you can apply business logic to create actionable rules, such as offering product bundles during peak business hours or running targeted discounts for underperforming items.
Example 2: Business Logic First
Consider a healthcare analytics project where the goal is to assess patient readmission rates. Business logic is critical upfront to:
- Define “readmission” (e.g., patients returning within 30 days).
- Determine the correct patient populations to include.
- Adjust metrics based on hospital-specific factors like department capacities.
Once the business logic is set, Exploratory Data Analysis could uncover patterns within the defined framework, such as readmission spikes related to specific conditions or discharge practices.
Example 3: Combining EDA and Business Logic Continuously
A SaaS business tracking user churn combines both approaches iteratively. First, business logic defines a “churned user” and establishes metrics like average session duration or number of interactions. Then, Exploratory Data Analysis explores whether unique factors like device type or location influence churn, leading to refined business logic and more effective user retention strategies.
How to Balance EDA and Business Logic for Optimal Results
Instead of viewing Exploratory Data Analysis and business logic as an either-or choice, think of them as complementary components of a cyclical process. Here are some actionable tips for balancing both:
1. Start Where the Context Demands:
- Opt for EDA first when working with uncleaned or unfamiliar datasets.
- Start with business logic when objectives, rules, and data structures are already defined.
2. Iterate Between Phases:
- Use EDA to uncover insights and update business rules as new patterns emerge.
- Apply business logic to shape datasets into actionable structures, then refine them with further EDA.
3. Collaborate Cross-Functionally:
- Data analysts and domain experts should work together so that the analysis aligns with real-world business needs.
4. Utilize the Right Tools:
- Leverage comprehensive analytics platforms that can handle both exploratory and rule-based analyses. For example, Tableau integrates EDA visualization capabilities with business dashboards.
5. Document Insights:
- Maintain clear records of your EDA findings and how they influence subsequent business logic adjustments.
Strengthening Insights with Advanced Analytical Approaches
Modern analytics projects benefit greatly from structured and systematic evaluation methods. Beyond basic summaries and visualizations, professionals apply advanced Data Analysis Techniques to extract deeper insights from complex datasets. These methods may include regression modeling, clustering, segmentation, and correlation analysis to uncover meaningful relationships between variables. When combined with business logic, these techniques ensure that findings are not only statistically sound but also strategically relevant. Analysts who understand when and how to apply the right analytical approach can move from surface-level observations to actionable intelligence. This strengthens decision-making processes and allows organizations to respond proactively rather than reactively to emerging trends and challenges.
Leveraging Web Metrics for Smarter Decisions

Digital businesses generate enormous volumes of user interaction data. Proper interpretation of this information requires both exploratory thinking and structured rule definitions. Through Google Analytics Data Analysis, organizations can evaluate traffic sources, user journeys, bounce rates, and conversion funnels. However, simply reviewing dashboards is not enough. Analysts must explore anomalies, compare time-based performance shifts, and align findings with predefined KPIs. When EDA is combined with clear business logic, website optimization becomes more strategic and measurable. This balanced approach allows companies to refine marketing strategies, enhance user experiences, and maximize return on investment while ensuring that decisions are rooted in reliable evidence rather than assumptions.
Transforming Raw Data into Meaningful Information
Data alone does not create value unless it is structured, interpreted, and contextualized correctly. Data Information Analysis focuses on converting unstructured or scattered datasets into organized insights that support decision-making. This process includes cleaning inconsistencies, validating accuracy, categorizing variables, and ensuring alignment with business objectives. When analysts begin with exploration, they uncover quality issues or hidden patterns. When they integrate business logic, they ensure that transformations reflect operational needs. Together, these steps create a reliable analytical foundation. Organizations that prioritize structured interpretation avoid misleading conclusions and improve their ability to communicate findings clearly to stakeholders, executives, and cross-functional teams.
Moving from Exploration to Forecasting
While exploratory analysis uncovers what has already happened, forecasting focuses on what is likely to happen next. Predictive Analytics builds on both EDA and business logic to create forward-looking models based on historical patterns. By analyzing trends, seasonality, and behavioral indicators, analysts can estimate future sales, customer churn, or operational risks. However, predictions must be grounded in clearly defined business rules to remain relevant and accurate. Combining structured logic with exploratory findings enhances model reliability and reduces bias. This integration allows organizations to shift from reactive reporting to proactive strategy, giving them a competitive advantage in fast-changing markets.
Building a Data-Driven Decision Framework

A successful analytics strategy requires more than isolated reports or dashboards. It demands a clear framework that integrates exploration, structured rules, and continuous validation. Analysts should begin by understanding the dataset, then define business objectives, and repeatedly refine insights through iterative evaluation. This balanced methodology ensures both discovery and precision. Clear documentation, cross-team collaboration, and regular performance reviews further strengthen analytical outcomes. When organizations adopt a disciplined yet flexible approach, they reduce errors, improve transparency, and enhance strategic alignment. Over time, this creates a culture where data-driven decision-making becomes standard practice rather than an occasional initiative.
Choosing the Right Starting Point
How much EDA or how much business logic you have to apply largely depends on the scope of your project, its objectives, and the data you have at your disposal. Where EDA is the exploratory base, business logic is the mechanism that the results are held against for actionable meaning. Both are indispensable tools to analyse and create value with data for analysts, data scientists, and business users who seek to solve real-world problems.
For most projects, applying both approaches in a fluid, iterative process will be the most effective. By mixing careful exploration with clear logic, you’ll extract the greatest value from your data.
Frequently Asked Questions (FAQ)
1. What is the main difference between EDA and business logic?
Exploratory Data Analysis (EDA) focuses on understanding the dataset by identifying patterns, trends, anomalies, and relationships. It helps analysts become familiar with the data. Business logic, on the other hand, defines the rules, metrics, and context that align data analysis with organizational goals. In simple terms, EDA explores what the data says, while business logic determines what the data should mean for the business.
2. Should EDA always come before business logic?
Not necessarily. If you’re working with a new or unfamiliar dataset, starting with EDA is usually best. However, if the project has clearly defined objectives, KPIs, and rules—such as recurring reports—business logic may come first. In many real-world projects, both approaches are used iteratively.
3. What happens if you skip EDA?
Skipping EDA can lead to incorrect assumptions about data quality, structure, or patterns. You might overlook missing values, outliers, or inconsistencies that could distort results. This increases the risk of flawed conclusions and poor decision-making.
4. What are the risks of focusing only on business logic?
If you rely solely on predefined business rules without exploring the dataset, you may miss unexpected insights or hidden trends. You could also fail to detect anomalies that impact performance metrics. This limits innovation and deeper discovery.
5. When is business logic most important?
Business logic is critical in operational analytics, compliance reporting, KPI tracking, healthcare metrics, financial calculations, and automated dashboards. In these cases, precise definitions and standardized rules ensure consistency and reliability.
6. Can EDA and business logic be used together?
Yes, and they often should be. Many successful analytics projects follow a cyclical process: start with EDA to explore patterns, apply business logic to define structure and meaning, then return to EDA to refine insights. This iterative approach ensures both discovery and alignment.
7. What tools are commonly used for EDA?
Common EDA tools include Python libraries such as Pandas, NumPy, and Matplotlib, R for statistical analysis, and visualization platforms like Tableau or Power BI. These tools help analysts summarize, visualize, and understand data effectively.
8. Who is responsible for defining business logic?
Business logic is typically defined collaboratively. Domain experts, business stakeholders, product managers, and data analysts work together to ensure that metrics, definitions, and rules align with organizational objectives.
9. Is EDA only for data scientists?
No. While data scientists frequently perform EDA, business analysts, BI developers, and even product teams use exploratory techniques to understand trends and generate insights before making decisions.
10. What is the best strategy for balancing EDA and business logic?
The best strategy is flexibility. Begin with whichever approach fits the project context, but continuously iterate between exploration and rule definition. Clear documentation, collaboration, and ongoing validation ensure that insights remain both accurate and actionable.