Data is the new fuel of business today. From customer behaviour to sales numbers, operational metrics to customer service data, facts and figures are key to making informed decisions. But how do you process the raw data? Enter descriptive analytics. This is how companies figure out the “what” of the data and create better strategies.
Read on to find out what descriptive analytics is, how it operates, useful tools and practical methods, and how businesses can apply it today to derive actionable insights and improve decision-making.
Understanding Descriptive Analytics
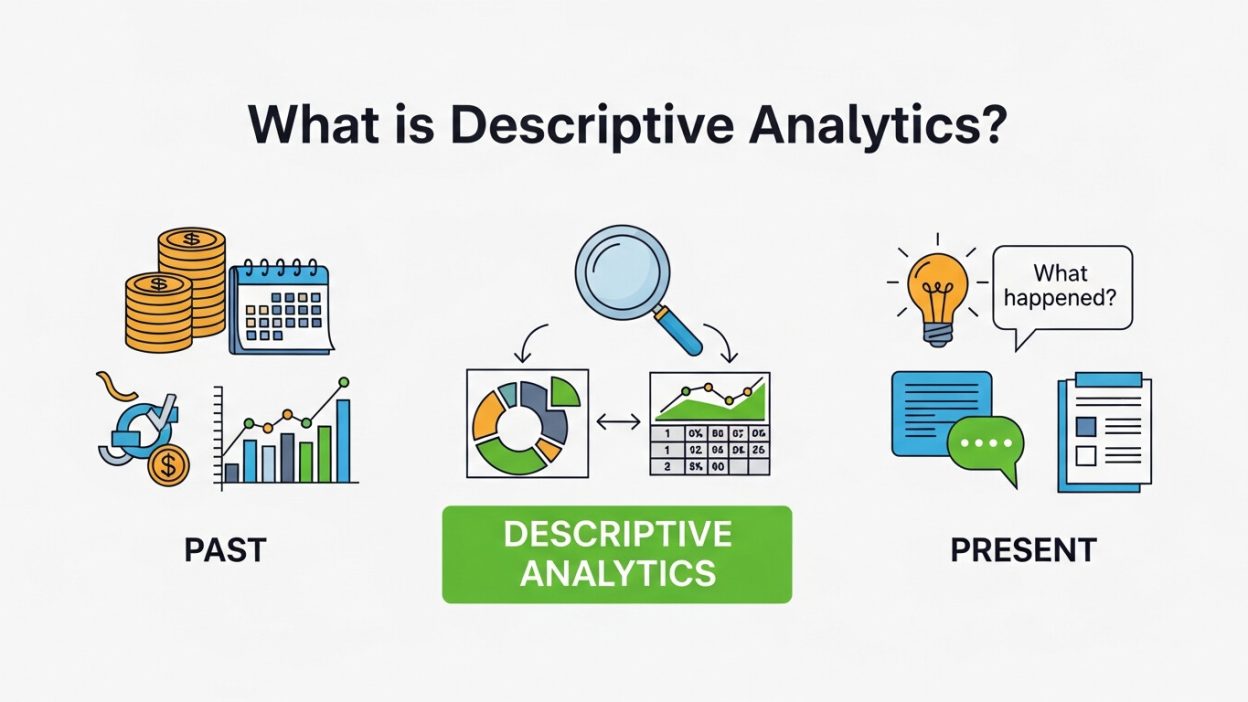
What is Descriptive Analytics?
Descriptive analytics is the examination of data or content, usually manually performed, to answer the question What happened ? or What is happening.? It’s the who, what, where, why and how. or “What is going on here at this moment?” By distilling huge pools of raw information, companies are able to produce a focussed and concise overview of past and present activities.
For instance, a company examining sales from last month can utilize descriptive analytics to determine which products sold the most, which days had more foot traffic, and which regions bested all others.
How Does It Work?
Descriptive analytics uses a combination of data processing and statistical techniques to uncover insights. The process typically involves:
- Collecting Data from various sources like sales systems, customer databases, or marketing platforms.
- Organizing Data into structured formats such as tables or spreadsheets.
- Summarizing the data using metrics like averages, totals, and percentages.
- Presenting Results through visuals, such as graphs, heatmaps, or dashboards, which make the data easier to interpret.
Unlike predictive or prescriptive analytics that focus on forecasting future outcomes or recommending actions, descriptive analytics is all about looking at past and present data. It sets the stage for deeper analysis.
How Descriptive Differs from Other Analytics
To better understand descriptive analytics, it’s helpful to distinguish it from other types:
- Predictive Analytics forecasts future outcomes using statistical models and machine learning.
- Prescriptive Analytics suggests specific actions based on data insights.
- Diagnostic Analytics explores why events happened by digging into root causes.
Descriptive analytics acts as the building block for these more advanced methods by providing the necessary historical context.
Key Techniques and Methods
A critical part of descriptive analytics is employing techniques that bring clarity to complex datasets. Here are some of the most common methods used in businesses today:
1. Data Aggregation
Data consolidation combines data from diverse sources into a more coherent format. Sales data from a variety of outlets, for instance, may be consolidated into a single dataset showing how the company is doing overall. That offers an aerial view of operations.
2. Data Mining
Whereas data aggregation groups data, data stripping looks for patterns and trends. Use of algorithms means businesses can analyse data and uncover non-obvious insights. For example, a store might find that people who buy Product A are also more likely to purchase Product B
3. Data Visualization
Three of the fundamental parts of descriptive analytics are graphs, charts, and dashboards. Bar graphs, line charts, and pie charts can be used as tools to help you read and interpret numbers and trends with ease. Software such as Tableau or Power BI facilitates the creation of interactive dashboards presenting KPIs on a single screen.
Real-World Applications
Descriptive analytics has diverse applications across industries. Here are two examples of how it’s transforming businesses:
Retail Sales Analysis
Now imagine a retail chain trying to make sense of the goods they sold last holiday season. With descriptive analytics, they learn which products fared best, which times on which nights drew the most visitors and which stores brought in the most income. Using this information, they tweak the next campaigns, optimize inventory better, and drive revenue up.
Healthcare Patient Analysis
Descriptive analytics helps hospitals by analyzing the patient data they collect. For instance, they can find patterns in seasonal diseases, measure the wait time of patients, or observe recovery times. This allows hospitals to make better use of resources and positively impact patient care.
Benefits and Advantages
Why are businesses investing in descriptive analytics? Here are some of the key benefits:
Improved Decision-Making
By understanding past performance, businesses can make more accurate and informed decisions. Knowing which marketing campaigns succeeded (or didn’t) informs future tactics.
Better Understanding of Trends
Identifying patterns over time, such as seasonal sales spikes or customer preferences, helps businesses anticipate changes and adapt more effectively.
Enhanced Reporting
Descriptive analytics creates concise, easy-to-read reports tailored for stakeholders or team members. These summaries make it easier for everyone to stay aligned and make data-driven decisions.
Challenges and Limitations
While descriptive analytics offers many benefits, there are some challenges businesses need to address:
Data Quality Issues
The insights derived from descriptive analytics are only as good as the data itself. Poor-quality data, such as missing or inaccurate entries, can lead to misleading conclusions. Implementing robust data collection and validation processes is critical.
Potential for Misinterpretation
Even with clear visualizations and summaries, there’s always a risk of misinterpreting data or drawing incorrect conclusions. Businesses should pair analytics tools with expert oversight to avoid errors.
Tools and Technologies
Descriptive analytics wouldn’t be as accessible without innovative tools that process and visualize data. Popular tools used by businesses include:
- Tableau for creating interactive, visually appealing dashboards.
- Microsoft Power BI for robust business intelligence and data modeling.
- Google Data Studio is free, with user-friendly visualization options integrated with Google tools.
These platforms make it easy for teams to analyze data without requiring advanced technical skills.
Best Practices
To get the most out of descriptive analytics, follow these best practices:
- Ensure Data Accuracy: Regularly clean and validate your data to avoid errors in analysis.
- Focus on Relevant Metrics: Choose KPIs that align with your business goals and avoid information overload.
For example, an e-commerce business may focus on cart abandonment rates or average order value over dozens of secondary metrics.
Leveraging Customer Insights for Better Decisions
Understanding your audience is key to improving business strategies. By collecting and analyzing customer behavior and transaction history, companies can tailor products, promotions, and services to meet demand more effectively. Integrating tools like Customer Data Platforms enables organizations to centralize data from multiple channels, creating a unified view of each customer. This not only improves personalization but also enhances engagement and loyalty. Teams can identify high-value customers, segment audiences, and predict trends more accurately. By using insights from such platforms, businesses gain actionable knowledge that informs marketing campaigns, inventory planning, and product development, ultimately driving higher revenue and more meaningful customer experiences.
Optimizing Marketing Campaigns with Data
Modern marketing relies heavily on analyzing results to refine campaigns. By tracking metrics like click-through rates, conversion rates, and engagement, businesses can determine which strategies work best. Data marketing analytics allow teams to test different approaches, target specific audiences, and allocate budgets efficiently. Insights drawn from this analysis help optimize email campaigns, social media ads, and content marketing initiatives. Over time, patterns emerge, revealing what messaging resonates most, which channels drive the highest ROI, and how customers progress through the purchase journey. Organizations that consistently leverage these insights are better positioned to maximize marketing effectiveness, reduce wasted spend, and deliver tailored experiences that boost customer satisfaction.
Training Teams for Data Proficiency
To make data-driven decisions, organizations need employees skilled in interpreting analytics. Participating in a Data Analysis Bootcamp equips teams with essential skills like Excel modeling, data visualization, and statistical analysis. Employees learn to transform raw numbers into actionable insights, identify trends, and make recommendations that improve operations. Hands-on training in dashboards, KPIs, and reporting techniques ensures teams can communicate findings effectively across departments. By upskilling staff, companies reduce reliance on external consultants and empower employees to make evidence-based decisions. Over time, this cultural shift toward data literacy improves overall efficiency, encourages innovation, and helps the business respond proactively to market and customer behavior changes.
Monitoring Sales Performance for Growth
Tracking product and service performance is critical for business success. By analyzing historical sales data, organizations can identify high-performing products, seasonal trends, and underperforming inventory. Customer preferences, pricing sensitivity, and geographic differences can also be examined to refine strategies. Tools that aggregate sales information allow teams to see patterns across multiple channels, enabling better planning and forecasting. Using this data-driven approach, businesses can optimize stock levels, improve promotional strategies, and adjust pricing dynamically. Over time, these insights help maximize revenue, reduce costs, and strengthen customer satisfaction, ensuring the company stays competitive and responsive to market fluctuations.
Enhancing Customer Experience with Analytics
Providing a personalized and seamless customer experience is essential in today’s competitive landscape. By analyzing customer interactions, preferences, and purchase patterns, companies can predict needs and deliver tailored recommendations. Insights from behavioral data help optimize website navigation, streamline checkout processes, and create loyalty programs that resonate. Companies can also anticipate pain points and proactively address issues before they affect satisfaction. Combining these insights with feedback and support data ensures a more holistic understanding of the customer journey. Ultimately, businesses that leverage this approach improve retention, boost lifetime value, and create strong emotional connections with their audience, fostering brand loyalty and positive word-of-mouth.
Driving Strategic Decisions with Cross-Department Data
Data is most powerful when shared across departments. Integrating sales, marketing, operations, and finance data allows leaders to see the big picture and make strategic decisions based on comprehensive insights. Patterns identified from multiple sources reveal bottlenecks, inefficiencies, or growth opportunities that might be missed in isolated silos. Advanced analytics tools enable executives to simulate scenarios, forecast outcomes, and assess risks before making major investments. This holistic view ensures alignment across teams, facilitates collaboration, and supports initiatives that drive long-term profitability. Over time, the consistent use of cross-department data strengthens organizational intelligence and fosters a culture of evidence-based decision-making.
Scaling Business Operations with Predictive Insights
Even though descriptive analytics focuses on past data, combining it with predictive approaches prepares companies for growth. Organizations can use patterns identified from historical data to forecast customer demand, optimize inventory, and plan resources effectively. Predictive insights support marketing, operations, and product development decisions, reducing uncertainty. Training staff through programs like Data Analysis Bootcamp enhances their ability to interpret these patterns accurately, ensuring forecasts translate into actionable strategies. By leveraging these insights, companies can scale operations efficiently, reduce costs, and enhance customer satisfaction. The proactive use of data ensures businesses are agile and well-prepared for future opportunities and challenges.
The Role of Descriptive Analytics in Modern Data Analysis
Descriptive analytics is the starting point for deeper data insights. It provides essential context, helping businesses identify what’s working, what’s not, and where to go next. By investing in advanced tools and following best practices, your business can transform raw data into a powerful asset.
Want to take your data analysis to the next level? Explore tools like Tableau or Power BI to start visualizing and understanding your business data today.
For a complete picture, it’s also useful to understand what web analytics is and why it matters for your website.
Frequently Asked Questions (FAQ) – Descriptive Analytics
1. What is descriptive analytics?
Descriptive analytics is the process of examining historical or current data to answer the question, “What happened?” or “What is happening?” It helps businesses summarize and understand past trends, performance, and user behavior.
2. How is descriptive analytics different from predictive analytics?
While descriptive analytics focuses on understanding past and present data, predictive analytics forecasts future outcomes using statistical models and machine learning.
3. What types of data can be analyzed using descriptive analytics?
Any structured data can be analyzed, including sales numbers, website traffic, customer interactions, operational metrics, or survey responses.
4. What are the common techniques used in descriptive analytics?
Key techniques include data aggregation (combining datasets), data mining (finding patterns), and data visualization (graphs, dashboards, charts) to make insights easier to interpret.
5. How does descriptive analytics benefit businesses?
It improves decision-making, highlights trends, enhances reporting, optimizes operations, and helps businesses allocate resources more effectively.
6. Which industries use descriptive analytics?
Almost every industry benefits, including retail, healthcare, finance, marketing, manufacturing, and logistics, wherever data-driven decisions are needed.
7. What tools are commonly used for descriptive analytics?
Popular tools include Tableau, Microsoft Power BI, and Google Data Studio for visualization, along with Excel for basic analysis.
8. Can small businesses use descriptive analytics?
Yes, even small businesses can leverage descriptive analytics using affordable tools and existing data to understand sales, customers, and operations better.
9. What are the limitations of descriptive analytics?
It cannot predict future events or suggest actions. Its accuracy depends on data quality, and misinterpretation can lead to wrong conclusions.
10. How can businesses get started with descriptive analytics?
Start by collecting accurate and structured data, focus on relevant KPIs, use visualization tools to summarize results, and regularly review findings to guide decisions.